Introduction
Hydroxychloroquine (HCQ) was first introduced as an antimalarial and subsequently applied to the treatment of autoimmune diseases such as rheumatoid arthritis, systemic lupus erythematosus and chronic ulcerative stomatitis [1-4]. HCQ is administered as a racemic mixture of R(–) and S(+) isomers and is metabolized in the liver to three metabolites, desethylhydroxychloroquine (DHCQ), desethylchloroquine (DCQ) and bisdesethylchloroquine (BDCQ) [5]. McLachlan et al. reported a stereoselective in vitro protein binding of HCQ stereoisomers in pooled human plasma. The (S)-enantiomer of HCQ was 64% bound and (R)-isomer was 37% bound in human plasma [6]. Further, the absorption and early distribution of HCQ enantiomers were investigated following a single dose of HCQ racemate. The absorption was not stereoselective (74% of the dose for the R compared with 77% for the S) [7]. Ducharme et al. reported that the stereoselectivity of HCQ may reflect the net balance of the affinity of different enzymes [8].
In several pharmacokinetic studies, HCQ showed a long terminal elimination half-life up to 40 days [9-15]. Hence, a steady state level of HCQ in the blood could only be attained after six months of HCQ treatment [15]. A number of different approaches determined HCQ and its metabolites in biological fluids, and almost all the assays used HPLC with a run time exceeding 10 min [16- 20]. Wang et al. reported the determination of HCQ in the patient blood samples using chromatography-tandem mass spectrometry (LC-MS/MS) with a run time of 3 min at the lower level of quantification (LLOQ) of 5 ng/ mL using API 4000 triple quadrupole mass spectrometer [21].
In this study, a simple, rapid and reproducible method to estimate HCQ and DHQC at an LLOQ 2 ng/mL in human whole blood was developed using Waters Micromass LC-MS/MS. This method yields high accuracy, sensitivity and specificity. Using the method, a bioequivalence or pharmacokinetic study was conducted to estimate the concentration of HCQ in whole blood samples collected from healthy volunteers.
Materials and Methods
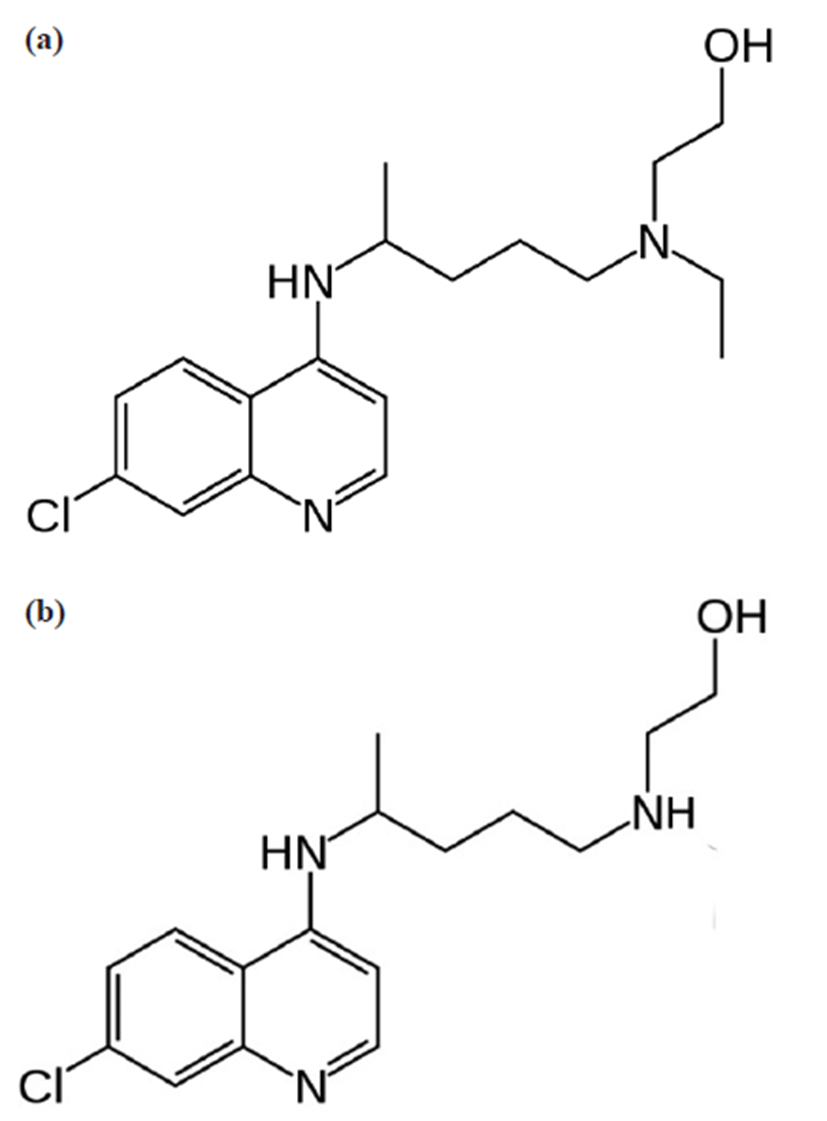
A hydroxychloroquine (HCQ) sulphate standard (98% pure by HPLC) was provided by UNIMED Pharm Inc. (Seoul, Republic of Korea) and desethylhydroxychloroquine obtained from TLC PharmaChem Inc. (Vaughan, Ontario, Canada). The internal standard (IS), hydroxychloroquine- D4 sulphate was purchased from Santa Cruz Biotechnology, Inc. (Dallas, TX, USA). Reagent-grade formic acid (98%) and ammonium formate (97%) were purchased from Sigma-Aldrich (St. Louis, MO, USA). HPLC-grade methanol was obtained from JT Baker in USA. Milli-Q water was obtained from a Milli-Q Plus system (Millipore, Milford, MA, USA). Drug-free (blank) human whole blood was obtained from healthy volunteers at the Bestian Bucheon Hospital, Republic of Korea. The structures of HCQ, (R,S)-2-[{4-(7-chloroquinolin- 4-yl) amino] pentyl} (ethyl)amino]ethanol and its major metabolite desethyl hydroxchloroquine are presented in Fig. 1 [22].
Oxiklorin sugar-coated tablet (hydroxychloroquine sulfate 200 mg, reference product with a batch number 032039) was manufactured by Elyson Pharmaceutical Co., Ltd., Seoul, Republic of Korea. Aruquin sugarcoated tablet (hydroxychloroquine sulfate 200 mg, test product, with a batch number 12012) was manufactured by UNIMED Pharm. Inc., Seoul, Republic of Korea. All pharmaceutical products were developed under good manufacturing practices (GMP) according to regulations of Ministry of Food and Drug Safety (MFDS).
Quantitative analysis was performed on a Waters Acquity Alliance 2795 LC system (Milford, MA, USA) interfaced with a Waters MICROMASS® Quattro microTM API triple quadrupole mass spectrometer and equipped with electrospray ionization operated in the positive ionization mode. Chromatographic separation of HCQ and DHCQ was achieved using a Kinetex PFP 100A column (50 × 4.6 mm, 2.6 μm; Phenomenex, Torrance, CA, USA). The column was maintained at 45℃ and a system pressure of 600 psi. The mobile phase consisted of 0.01 mol/L of ammonium formate in methanol containing 0.1% formic acid along with 0.005 mol/L of ammonium formate in water containing 0.2% formic acid (7:3). It was delivered isocratically at a flow rate of 0.45 mL/min with 20 μL injection. Detection of the ions was performed in a multiple reaction monitoring (MRM) mode, by monitoring the transition pairs (precursor to product ion) of m/z 336.07 to m/z 247.23 for HCQ, m/z 307.82 to m/z 246.85 for DHCQ and m/z 340.13 to m/z 251.16 for HCQ-D4 (IS). HCQ, DHCQ and IS were nebulized by nitrogen gas and introduced into the detector at 400℃. The optimum values for compound dependent parameters such as capillary voltage, cone voltage and collision energy were set at 3.3 kV, 33 V and 21 eV for HCQ; 3.3 kV, 32 V and 21 eV for DHCQ; 3.3 kV, 34 V and 20 eV for IS (HCQD4), respectively. Argon was used as a collision gas and the source temperature was set at 120℃. Waters Mass Lynx software version 4.1 was used to control all the parameters of the high performance liquid chromatography (HPLC) and the mass spectrometer (MS).
The primary stock solutions of HCQ (0.2 mg/mL), DHCQ (5 mg/mL) and HCQ-D4 (IS, 1 mg/mL) for preparation of standard and quality control samples were prepared with each standard reagent dissolved in 50% (v/v) methanol solution. Eight working solutions of HCQ and DHCQ were prepared by serial dilution with 50% methanol to obtain concentrations of 0.02, 0.05, 0.2, 0.5, 1.0, 2.0, 5.0 and 10.0 μg/mL for HCQ; and 0.02, 0.06, 0.2, 1.0, 5.0, 10.0, 20.0 and 40.0 μg/mL for DHCQ; respectively. A 1.0 μg /mL working solution of the internal standard, HCQ-D4 was prepared. All stock solutions and working solutions were stored at –20℃ until use. For each chromatographic run, calibrators were freshly prepared by adding 20 μL of each concentration of the stock solution to 180 μL of blank human whole blood followed by 50 μL of IS working solution and 800 μL of 100% methanol for removal of protein in the whole blood. The test tube was vortexed for 5 min, followed by centrifugation at 14,000 rpm for 10 min at 4℃. Subsequently, 700 μL of the supernatant was transferred to 1.5 mL polypropylene (PP) tube and supplemented with 100 μL of 0.005 mol/L ammonium formate water solution containing 0.2% formic acid followed by centrifugation at 14,000 rpm for 10 min. The supernatant 10 μL was injected per run for quantitative analysis using LC-MS/ MS. A standard calibration curve covering the range of 2 – 500 ng/mL for HCQ and 2 – 2,000 ng/mL for DHCQ was constructed with each of the seven concentrations and the linearity was validated using quality control (QC) samples at three levels for HCQ and HDCQ. The calibrators were prepared at the following concentrations of 2, 5, 20, 50, 100, 200 and 500 ng/mL for HCQ and 2, 6, 20, 100, 500, 1,000 and 2,000 ng/mL for DHCQ. Drug concentrations of unknown whole blood samples were backcalculated from the weighted (1/x2) linear least-squares fitted line of peak area ratio of HCQ or DHCQ to the IS, HCQ-D4 versus standard concentrations. The subject samples were quantified and calculated by interpolating from the standard calibration curve.
Validation
In terms of specificity, the method was determined by analyzing six different samples of the human whole blood to demonstrate the lack of chromatographic interference from endogenous components (data not shown). Interand intra-assay precision and accuracy were determined by analyzing five replicates at the LLOQ in addition to three different QC levels as described above on different days. The criteria for acceptability of the data included accuracy ±15% standard deviation (SD) from the nominal values and a precision ≤ 15% relative standard deviation (RSD). The recovery of HCQ and DHCQ was determined by comparing the responses of the analytes extracted at four different QC levels with the response of analytes in the standard blood sample at equivalent concentrations.
The effect of blood constituents on the ionization of analytes and IS was determined by comparing the responses of the standard blood QC samples with the response of analytes from neat samples at equivalent concentrations. Matrix effect was determined using similar concentrations of each analyte as in recovery experiment.
Three freeze-thaw cycles were selected for testing the stability. Three aliquots of each QC concentration were prepared in human whole blood stored at –70℃ for 24 h and thawed unassisted at room temperature. Upon completion of thawing, the samples were refrozen at –70℃ for 24 h. The freeze-thaw cycle was repeated twice to perform three freeze–thaw cycles for analysis of stability. The short-term stability of analytes in whole blood samples (with a low and high quality control samples) was studied for the period of 6 h at room temperature (25℃). Post-preparative stability was assessed during the resident time in the auto-plate sampler (4℃) by obtaining three repeated measurements after 24 h at low and high concentration (5 and 500 ng/mL). The stability of HCQ, DHCQ and HCQ-D4 standard primary stock solutions was assessed during the storage for 38 days. Three aliquots of stable samples were used to compare the freshly prepared stock solution with peak area. Stability of the stock solutions was used to determine the precision and variation rate within the peak mean area of the freshly prepared stock solution.
The purpose of the study was to investigate the bioequivalence of one tablet of Oxiklorin 200 mg (reference drug, Elyson Pharmaceutical Co., Ltd.) and one tablet of Aruquin 200 mg (test drug, UNIMED Pharm. Inc.) after a single oral dose administration of each to healthy adult volunteers under fasting conditions. The study was an open-label, balanced, randomized two-treatment, oneperiod, parallel, single-dose bioequivalence study in volving 50 subjects per group under fasting conditions. All 100 subjects in the two groups participated in this study comprising healthy Korean adult males. The primary end points or target variables of the study were Cmax (maximum serum concentration), AUC0-648h (area under the curve from time zero to 648 hours postdose) and AUCinf (AUC from zero to infinity), which were analyzed using the confidence interval approach. The secondary end points of the study included AUC0-648h / AUCinf, Tmax (time to reach maximum plasma concentration), Kel (elimination rate constant) and t1/2 (half-life). The subjects were informed about the objectives and possible risks involved in the study and a written consent was obtained. The study was conducted as per International Conference on Harmonization and MFDS guidelines.
The subjects were orally administered a single dose of reference and test formulations with 240 mL of water. Whole blood samples were collected at 0.0 (pre-dose), 1.0, 1.5, 2.0, 2.5, 3.0, 3.5, 4.0, 4.5, 5.0, 6.0, 8.0, 12, 24, 36, 48, 72, 120, 168, 312, 480 and 648 h after oral administration of the dose for test and reference formulations. Each study group comprised 22 samples of blood collection for drug analysis. The pharmacokinetic parameters of HCQ were estimated via non-compartmental analysis using Phoenix 64 WinNonline 6.3.3.395 (Pharsight, A CertaraTM Company). The 90% confidence interval for the difference in the least square means of the two formulations was calculated for the target variable using log-transformed data. Similarly, power and ratio analysis of the log-transformed data was performed. The terminal end points for the elimination rate constant were automatically selected using the best fit model in the software.
To determine whether the reference and the test formulations were pharmacokinetically equivalent, Cmax, AUC0- 648h and AUCinf and their ratios (test/reference) using logtransformed data were assessed. The drug formulations were considered equivalent if the difference between the parameters was statistically non-significant (p≥0.05) and the 90% confidence intervals for these parameters were within 0.8 –1.25.
Results and Discussion
HCQ and DHCQ were extracted using protein precipitation with 100% methanol. The ratio of precipitant to blood was set at 4:1 (v/v). After removal of precipitate, acidic ammonium formate solution was added to the supernatant followed by removal of residual precipitate to continue with the centrifugation. Sample preparation was accomplished by a two-step deproteinization to inject cleaner whole blood samples into the instrument, which facilitated the analysis of a large number of samples in a day without instrumental troubles. In a previous study, deproteinization using100% acetonitrile represented the best choice for achieving the most intensive mass signal of HCQ [22]. However, the test method for the extraction of HCQ was not clear and the shape of chromatographic peak at LLOQ 5 ng/mL was not very sharp.
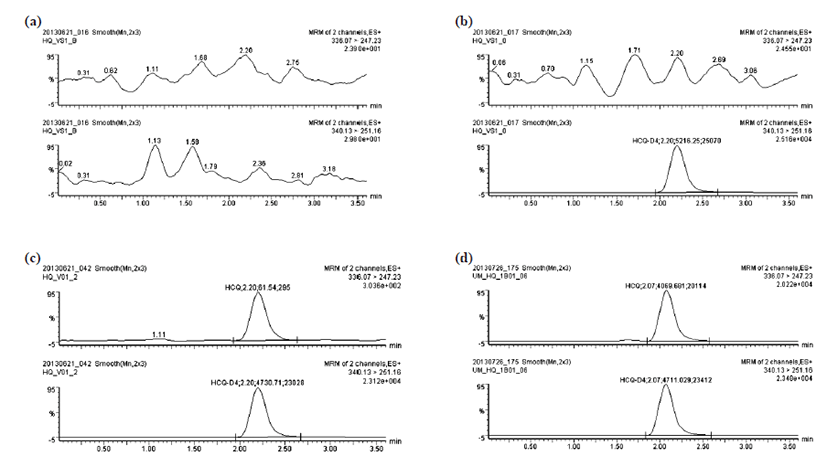
In this study, the effects of several chromatographic parameters were investigated to optimize the LC-MS/ MS method and to decrease the concentration to a 2 ng/ mL LLOQ. These included the type of organic modifier, the pH of aqueous solution, and the organic modifieraqueous ratio. These parameters were optimized based on the peak shape, peak intensity/area, peak resolution and retention time of the analytes on Kinetex PFP 100A column (50 × 4.6 mm, 2.6 μm). During the optimization of chromatographic analysis, the choice of the best optimal column is an important factor in achieving clear resolution and symmetric peak. Unlike commonly used C8 or C18 column with aliphatic carbon chain group, the PFP column contains a pentafluorophenyl group as a functional side chain, and the hydrophobic interaction between the pentafluorophenyl group in the column and the quinoline group of HCQ enhances the resolution in the whole blood sample. The mobile phase is another important factor in bioanalysis. The acidic mobile phase (ammonium formate buffer containing 0.2% formic acid) generates a sharp peak at LLOQ 2 ng/mL. HCQ, DHCQ and HCQ-D4 can be easily protonated under acidic mobile phase condition. These optimized conditions yielded clear and sharp chromatograms. Therefore, electrospray ionization in the positive ion mode was used for MRM analysis. Multiple reaction monitoring (MRM) was employed to monitor the precursor and product ions as they passed through the mass spectrometer. The optimal mass transitions were 336.07 > 247.23 m/z for HCQ, 307.82 > 246.85 m/z for DHCQ and 340.13 > 251.16 m/z for IS. No interfering peaks at the retention time of HCQ, DHCQ and the IS were detected after injection of the whole blood samples. Under the optimized conditions, each retention time of HCQ, DHCQ and IS was 2.20, 2.20 and 2.03 min, respectively.
The selectivity of the proposed method depended on its ability to differentiate and quantify the analytes from endogenous components in the whole blood matrix. Fig. 2 shows the chromatograms of (a) blank whole blood sample; (b) zero whole blood sample (spiked with IS); (c) whole blood sample containing LLOQ 2 ng/mL of HCQ; and (d) whole blood sample from B01 subject 3.5 h after administration of 200 mg HCQ tablet. The method selectivity was demonstrated using six blank whole blood samples obtained from healthy volunteers: the chromatograms were found to be free of interfering peaks. The calibration curves were linear in the range of 2 – 500 ng/ mL for HCQ and 2 – 2,000 ng/mL for DHCQ. The mean equations of the calibration curve obtained from 7 points were y = 0.00605262x + 0.00145653 (R2 = 0.999447) and y = 0.00147495x – 0.000968934 (R2 = 0.999273) for HCQ and DHCQ, in order. The limit of quantitation for both was 2 ng/mL.
Inter-day and intra-day validation was conducted using QC samples containing 2, 20, 100 and 500 ng/mL of HCQ, and 2, 6, 500 and 2,000 ng/mL of DHCQ. The precision, characterized by the relative standard deviation, was 3.45% and 2.79% at LLOQ, 0.7% and 1.73% at 20 ng/mL, 0.97% and 1.31% at 100 ng/mL, and 2.18% and 0.80% at 500 ng/mL for HCQ; 9.61% and 11.16% at LLOQ, 6.14% and 4.20% at 6 ng/mL, 3.04% and 1.22% at 500 ng/mL, and 1.85% and 1.02% at 2,000 ng/mL for DHCQ, respectively (Table 1 and 2).
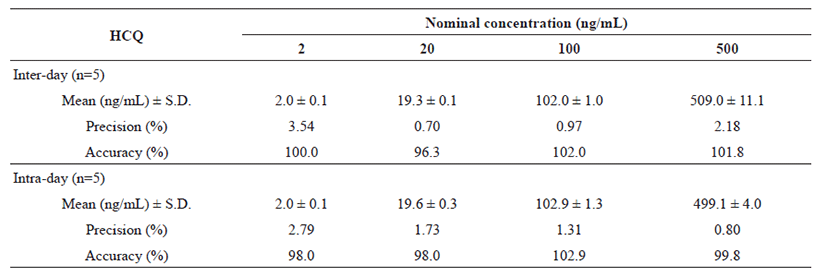

In compliance with the recovery methodology, the rate of accuracy between the true and the measured values expressed in percentages was investigated (100.0% and 98.0% at LLOQ, 96.3% and 98.0% at 20 ng/mL, 102.0% and 102.9% at 100 ng/mL, and 101.8% and 99.8% at 500 ng/mL for HCQ; 108.3% and 116.0% at LLOQ, 102.8% and 95.7% at 6 ng/mL, 95.9% and 95.1% at 500 ng/mL, and 103.1% and 100.7% at 2,000 ng/mL for DHCQ, respectively) (Table 1 and 2). Moreover, the mean extraction recovery of the analytes was calculated at all QC levels, which varied from 92.0% to 93.5%, 91.2% to 92.8%, and 92.5% to 93.4%, for HCQ, DHCQ and IS, in order. In addition, the matrix effect of whole blood on the ionization of analytes and IS was determined by comparing the responses of the post-extracted whole blood standard QC samples (n=4) with the response of analytes from neat samples at equivalent concentrations. The RSD of peak area ratios (analyte/IS) was lower than 2% and the RSD of peak areas of individual compounds was lower than 4%. The findings indicated the absence of significant ion suppression or enhancement effect.
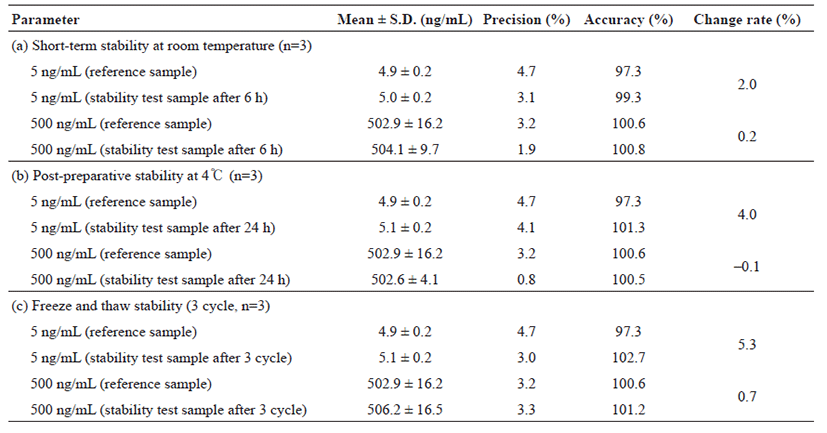
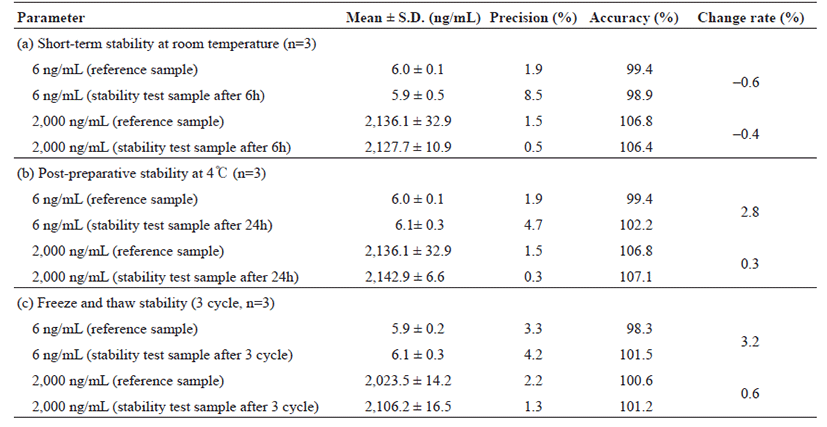
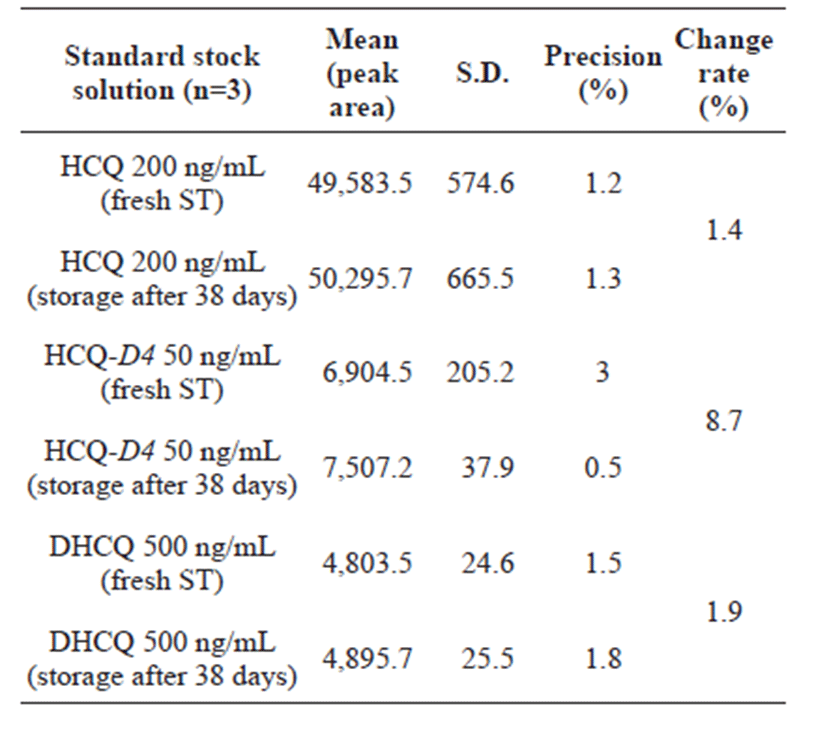
Tables 3 and 4 represent that the concentration change was less than 15% of the nominal concentration. The short-term stability of HCQ and DHCQ in whole blood samples (with a low and high QC samples) was determined for 6 h at room temperature (25℃), where the samples were stable under the studied conditions (Table 3 and 4). For post-preparative stability, three sets of spiked samples with low and high concentrations of HCQ and DHCQ were analyzed and left in the autosampler at 4℃ for 24 h. The processed samples (freshly prepared) were stable at 4℃ for storage in the auto-sampler. To determine the freeze and thaw stability, whole blood samples with low and high concentrations of HCQ and DHCQ were prepared in which the samples were stored at –70℃ and subjected to 3 freeze/thaw cycles. During each cycle, triplicate 1 mL aliquots were processed, analyzed and the results were averaged. No significant substance loss during repeated thawing and freezing was observed as shown in Tables 3 and 4. Finally, the stability of the standard stock solution was determined in the three sets of standard stock solution samples analyzed: 200 ng/mL for HCQ, 500 ng/mL for DHCQ, and 50 ng/mL for IS. The samples were stored at 4℃ for 38 days. Freshly prepared samples were analyzed. The processed samples were stable at 4℃ for the storage period. The results are shown in Table 5.
The proposed method was applied to determine HCQ in whole blood samples in a bioequivalence study, which was approved by the ethics committee and MFDS. An open-label, randomized, single-dose study with a twogroup parallel design was conducted to compare the bioavailability of HCQ between the reference and the test products. A total of 100 healthy Korean adult male volunteers participated in this bioequivalence study. Because hydroxychloroquine has a terminal elimination half-life exceeding 40 days in humans, this bioequivalence study was designed to include a parallel study without a second period [23-24]. The subjects were divided into two groups of A and B for parallel bioequivalence study. Demographic characteristics in 100 subjects of A and B groups were as follows: mean age in the A group (n=50) was 24.9 ± 3.1 years; mean weight, 69.4 ± 7.7 kg; mean height, 175.1 ± 5.2 cm; and mean body mass index (BMI), 22.6 ± 2.3 kg/m2. The demographics in the group B (n=50) were: mean age, 25.4 ± 5.4 years; mean weight, 71.3 ± 7.4 kg; mean height, 175.0 ± 4.4 cm; and mean body mass index (BMI), 23.3 ± 2.1 kg/m2. The A group received one tablet of the reference product (Oxiklorin, hydroxychloroquine sulfate 200 mg) and the B group received one tablet of the test product (Aruquin, hydroxychloroquine sulfate 200 mg) under fasting conditions, in a randomized fashion without a washout period. Forty-eight subjects of group A and 48 subjects of group B completed the parallel study for 648 h and in total, 96 subjects' whole blood samples were analyzed.
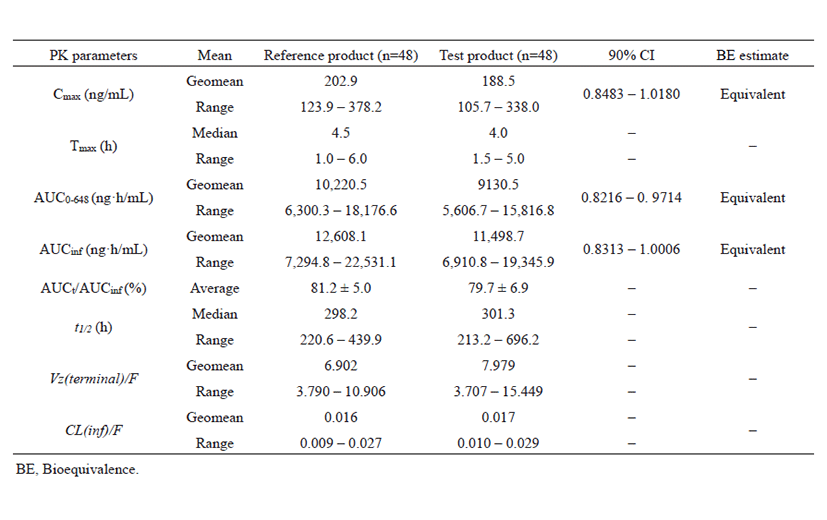
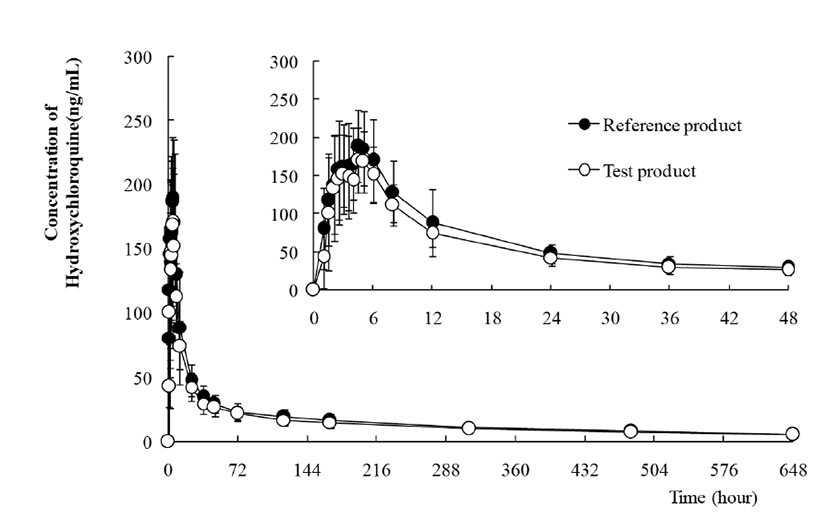
Fig. 3 shows the mean HCQ PK profiles of the reference product (n=48) and the test product (n=48) in the whole blood of subjects and the error bars indicate standard deviations at individual time points. Bioanalysis of DHCQ was not performed in this bioequivalence study. Table 6 shows the pharmacokinetic parameters of HCQ following oral administration of one tablet each of the reference and test products. The maximum concentration in the subject's blood, Cmax (geomean) and the area under the curve from 0 to 648 hours, AUC0-648 was 202.9 ng/mL (123.9 – 378.2) and 10,219.6 ng·h/mL (6,300.3 – 18,176.6) for reference product, and 188.5 ng/mL (105.7 – 338.0) and 9,130.1 ng·h/mL (5,606.7 – 15,816.8) for test product, respectively. The median values of Tmax and half-life were 4.5 h (1.0 – 6.0) and 298.2 h (220.7 – 439.9) for reference and 4.0 h (1.5 – 5.0) and 301.3 (213.2 – 696.2) for test. HCQ has long terminal half-life almost 10 – 20 days in a Korean healthy male. Based on log-transformed data, at a 90% confidence interval, the Cmax and AUC0-648 were 0.8483 – 1.0180 and 0.8216 – 0.9714, respectively. The results of this bioequivalence study showed the equivalence of Cmax and AUC in the two studied products. Thus, the two formulations can be considered bioequivalent in the extent and rate of absorption and therefore, interchangeable.
The developed and validated LC-MS/MS method facilitates the determination of hydroxychloroquine and its metabolite, desehylhydroxychloroquine, in human whole blood. The precision and accuracy of the method are well within the limits required for bioanalytical assays. Excellent linearity was demonstrated within the range of 2 – 500 ng/mL for HCQ and 2 – 2,000 ng/mL for DHCQ. Furthermore, the low limit of quantification (2 ng/mL for HCQ and DHCQ) allows application of the method in pharmacokinetic studies. Based on these results, it is possible to analyze more than 300 human whole blood samples per day.
Taken together, the assay developed represents a novel technology for the quantification of HCQ in human whole blood for a parallel design bioequivalence study in a healthy male.


