


Introduction
Korean Native Pig (KNP) which has a uniform black coat color and excellent meat quality is well known for full filling consumer’s demand for flavored pork meat [1, 2]. KNP produces white colored fat, solid fat structure and good marbling, however, its growth performance is low, while the western origin Yorkshire pig has high growth performance [3]. So a crossbred pig which could be high performing as well as high quality meat producing, was generated (KNP × Yorkshire) [4]. Liver is known to play a significant role in fat and lipid metabolism, although, meat quality of the pig depends upon multiple factors like intramuscular fat content, muscular pH, cholesterol level, drip loss, water holding capacity, texture, breed, feeding style, slaughtering and cooking loss [3, 5], fat content is the major deciding factor of pork meat quality[6, 7].
RNA-seq analysis of liver tissue of swine can be useful to decipher the liver fat metabolism and their significance to improve the meat quality. The pig reference genome Sscrofa10.2 still has missing annotation [8], and recently whole genome sequence using third generation sequencing; long read approach (PacBio); has been initiated for annotation of pig genome [9]. Since, RNA-seq is less prone to mapping artifacts, and can be directly mapped to the available reference genome, it can uncover the association between meat quality and liver fat metabolism. To the best of our knowledge, RNA-seq analysis has not been done so far for liver tissue of cross breed pig. In this study, we used transcriptome sequences from liver tissue of 16 crossbreed pig sample (KNP × Yorkshire), using illumina sequencing technology. Sequencing has been done at two different stages ;10 week and 26 week for comparative analysis. Until the age of 10 weeks, piglets are considered as weaners, and from 10 weeks to slaughtering time (around 26 weeks) pigs are considered as rearing pigs. We considered 10 weeks and 26 weeks, to infer gene expression changes, keeping in mind that during this time period gene expression of liver and fat metabolism will change due to the change in feeding regimen and also due to effects of age. After checking for the quality of the raw sequences we identified differentially expressed genes (DEGs). Gene ontology (GO) and KEGG pathway analysis performed to established the relation between fat metabolism and liver through transcriptome analysis. qRT-PCR was performed to validate the identified DEGs.
Materials and Methods
A total of 16 crossbred pigs between Korean native and Yorkshire breed were used in this study. The experiment was reviewed and approved by the Institutional Animal Care and Use Committee (IACUC no. NIAS2016-848). Feed and water were supplied during the experiment. These piglets were randomly allocated into two groups (n = 8). The two groups were raised for 10 weeks (stage 1) and 26 weeks (stage 2), respectively. The animals were sacrificed at the end of the growth stage and the liver tissues were collected for RNA-seq analysis. The tissues were dissected into pieces (1 cm3), and snap frozen in liquid nitrogen and stored at –80℃ until use.
Total RNAs of all the samples were extracted using TRIzol reagent (Invitrogen, United States USA), and quality checked using NanoDrop (Thermo scientific, United States USA). After performing quality control (QC), the samples were used for library preparation. The sequencing library is prepared by random fragmentation of the cDNA sample, followed by 5’ and 3’ adapter ligation. Adapter-ligated fragments were then PCR amplified and gel purified. For cluster generation, the library was loaded into a flow cell where fragments were captured on a lawn of surface-bound oligos complementary to the library adapters. Each fragment was then amplified into distinct, clonal clusters through bridge amplification. After cluster generation, the samples were sequenced in an Illumina Hiseq 4000 sequencer [10]. The sequencing was performed by Macrogen Inc., Korea. The quality of paired end reads of all 16 samples was checked by FASTQC (v0.11.4) program [11]. Low quality bases and adapter sequences were removed with Trimmomatic software [12]. Only good quality trimmed reads were considered for downstream analysis.
The reference genome of pig (sus scrofa) and annotation files were downloaded from NCBI (https://www. ncbi.nlm.nih.gov/genome?term=sus%20scrofa) as GCF_ 000003025.6_Ssrofa11.1_genomic.fa and indexed with Bowtie2 program (Bowtie2 v2.3.4.1) [13]. Paired end clean reads were mapped against the reference genome with HISAT2 (HIASAT2.1.0) alignment program. HISAT is a sensitive and fast alignment program for NGS reads for DNA as well as RNA [14]. Mapped sequences were taken into consideration for assembly through assembler cufflink (cufflink 2.2.1). Cufflink program was used to assemble the transcripts and find their abundance among the samples, with parameter ‘min-frags-per-transfrag = 0’ and –library-type’ and kept all parameters as default [15]. Cuffmerge, a tool of Cufflink suit was used to merged samples and get the merged gtf file for further downstream analysis.
Differential gene expression analysis was performed with EdgeR, which uses a negative binomial model for dispersion estimate for calculating biological variation [16]. Genes with an adjusted p-value (FDR) lower than 0.001 and a two-fold change was considered as significantly differentially expressed in the pairwise comparison of the samples stage 1 and stage 2. The R package Heatmaps was used to generate the DEG heatmap.
The GO database (http://www.geneontology.org/) was used for functional annotation of DEGs. The q value was calculated and GO terms with q < 0.05 were considered significantly enriched. The biological pathways and functions were analyzed on the basis of q value through DAVID, and ClusterProfiler. Similarly KEGG pathways were examined by keeping q value < 0.05 (http://www. genome.jp/kegg/).
The quantitative real time PCR was used to validate the top five DE genes by using a reverse transcriptase kit (Takara, Japan). 1 μg of total RNA was used to synthesize as the template for quantitative PCR by the SYBR Premix Ex Taq kit (Takara, Japan). Quantitative PCR analyses were conducted using the CFX96 Touch real-time PCR system (Bio-Rad, CA, USA). The PCR conditions were as follows; reverse transcriptase at 60℃ for 90 minutes, followed by denaturing at 95℃ for 8 min and then 40 cycles of replication 94℃ for 15 s and 60℃ for 1 min; then melting curve was run from 65–95℃ at each amplification cycle for the three replicates.
Results and Discussions
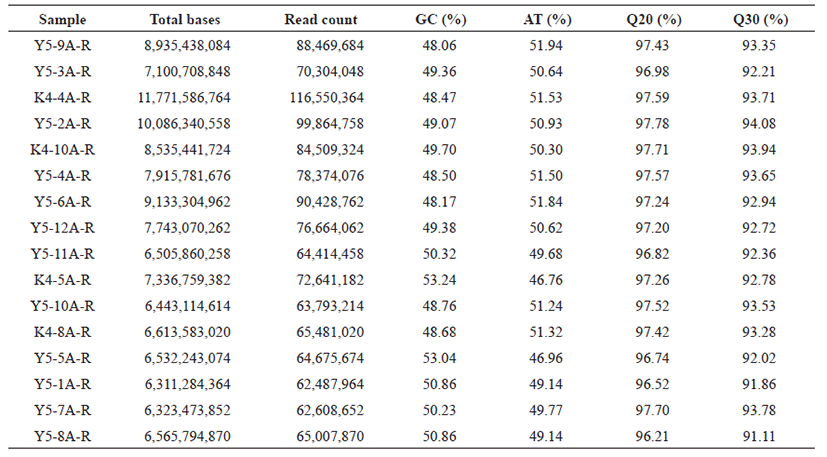
Raw reads obtained from transcriptome sequencing, were processed using FastQC and trimmed by removing adaptor sequences with Trimmomatic software [11, 12]. Clean transcriptome sequences were retrieved by removing adapter’s sequences, and removing the low quality reads (Phred quality score ≤ 10). The percentage of GC, AT, Q20, Q30 of the cleaned reads were calculated and shown in Table 1 for all the sixteen samples.
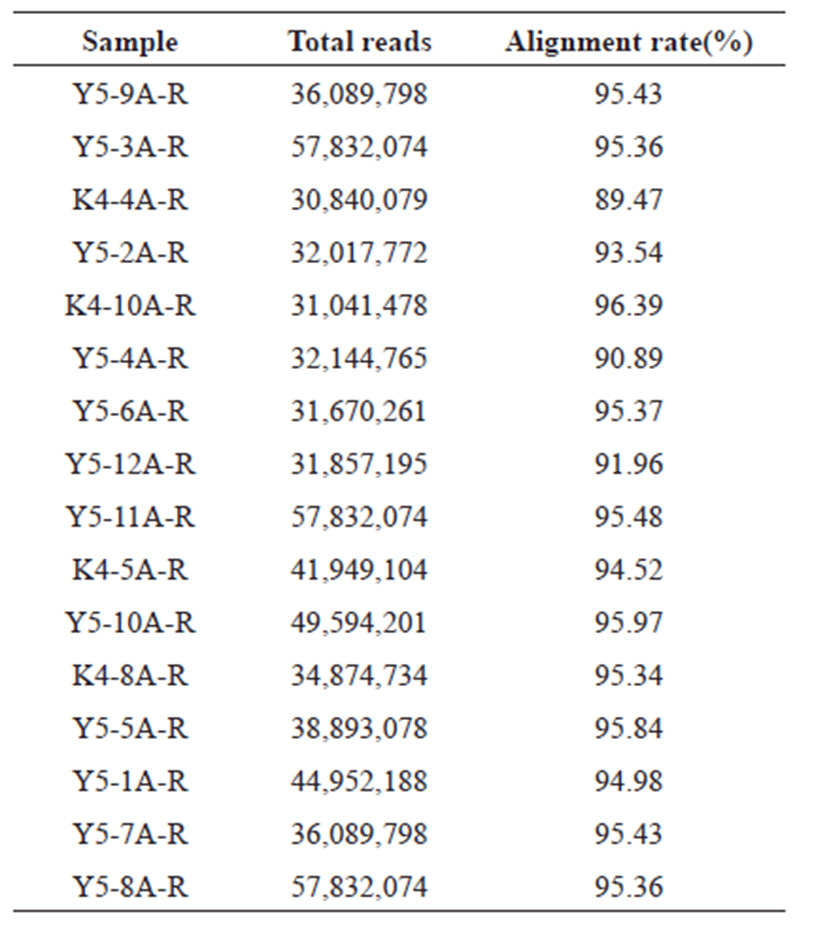
Clean reads of all samples were considered for alignment with the reference genome of pig (GCF_000003025.6_ Ssrofa11.1_genomic.fna). HISAT2 was used for alignment, alignment percentage of all samples are between 89 % and 95 % as shown in Table 2. The aligned samples were counted using featurecounts (ver 1.6.3) in the Subread package [17].
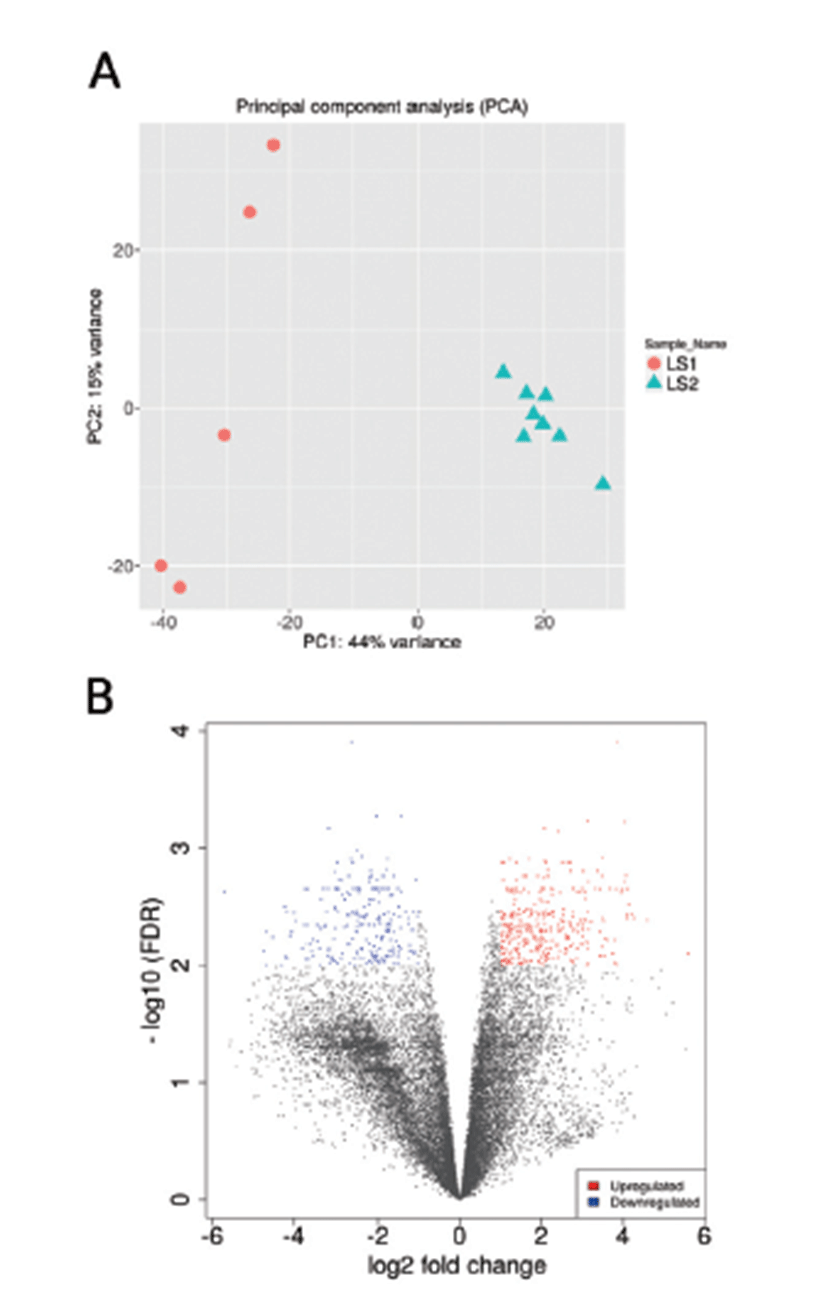
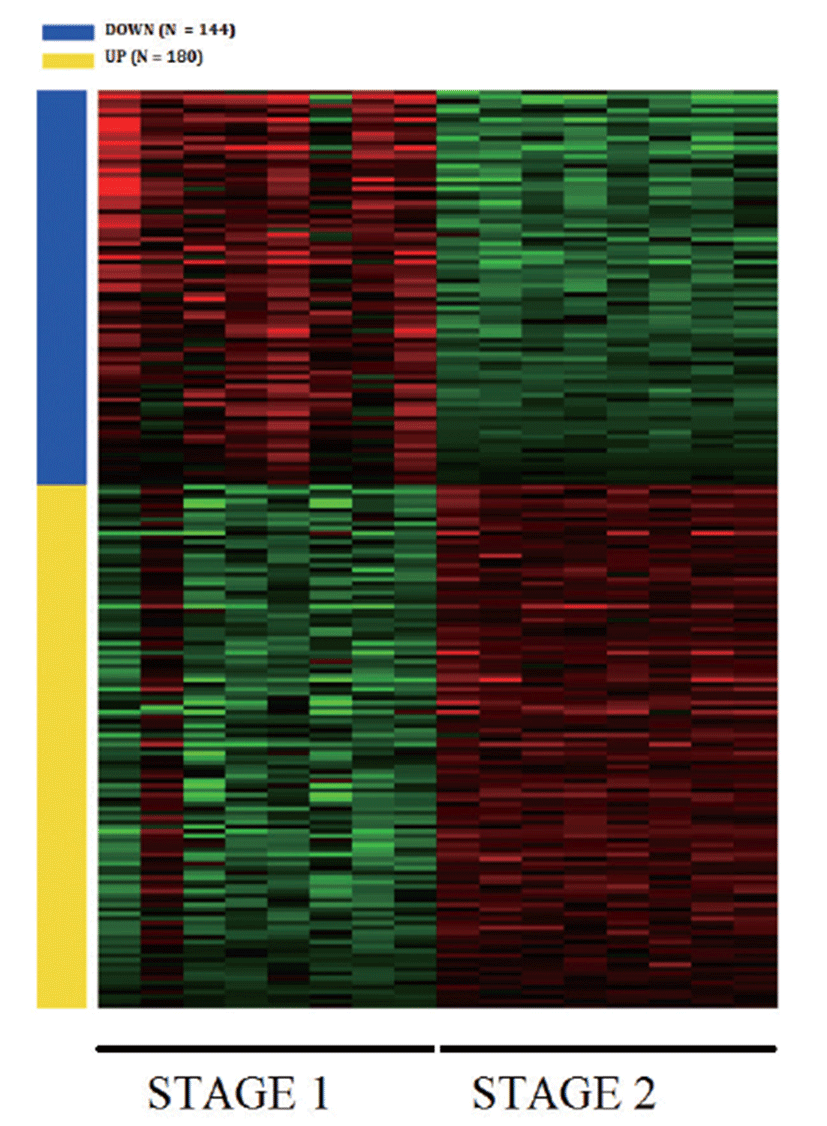
Principal Component Analysis (PCA) showed that the samples clustered according to stages (Fig. 1A) and Volcano plot were generated to show the DEGs between stage 1 and stage 2 as shown in Fig. 1B. A total of 20,396 clean mapped transcripts were considered for further analysis, and a total of 324 genes were found to be significantly differentially expressed (|log2FC| > 1 & q < 0.01), out of which 180 genes were up-regulated and 144 genes were down-regulated. Hierarchical clustering of the DEGs showed that the samples clustered based on condition (stage 1 vs stage 2) in Fig. 2. In Table 3, we report DEG that plays an important role in fat and lipid metabolism for example PATZ1 gene is involved in synthesis of long-chain polyunsaturated fatty acids (LU-PUFAs) by participating with the FADS1 (fatty acid desaturase 1) and FADS2 genes [18]. Fatty acids metabolism depends upon competitive binding between the PATZ1 and SP1 (specificity protein 1) and SREBP1c (sterol regulatory element-binding protein 1c), which determines the enhancer activity and regulates the expression of FADS1 [18–20]. Similarly, ZNF202 was found to be upregulated, it acts as a transcriptional receptor that can bind to the regulatory part of multiple genes involved in lipid metabolism. ZNF202 a zinc finger protein was reported to play a role in lipid metabolism in humans [21]. Another upregulated gene HAND2 (heart and neural crest derivatives expressed 2) is significantly associated with adipose differentiation through NOTCH signaling pathway, which is involved in lipid metabolism [22].
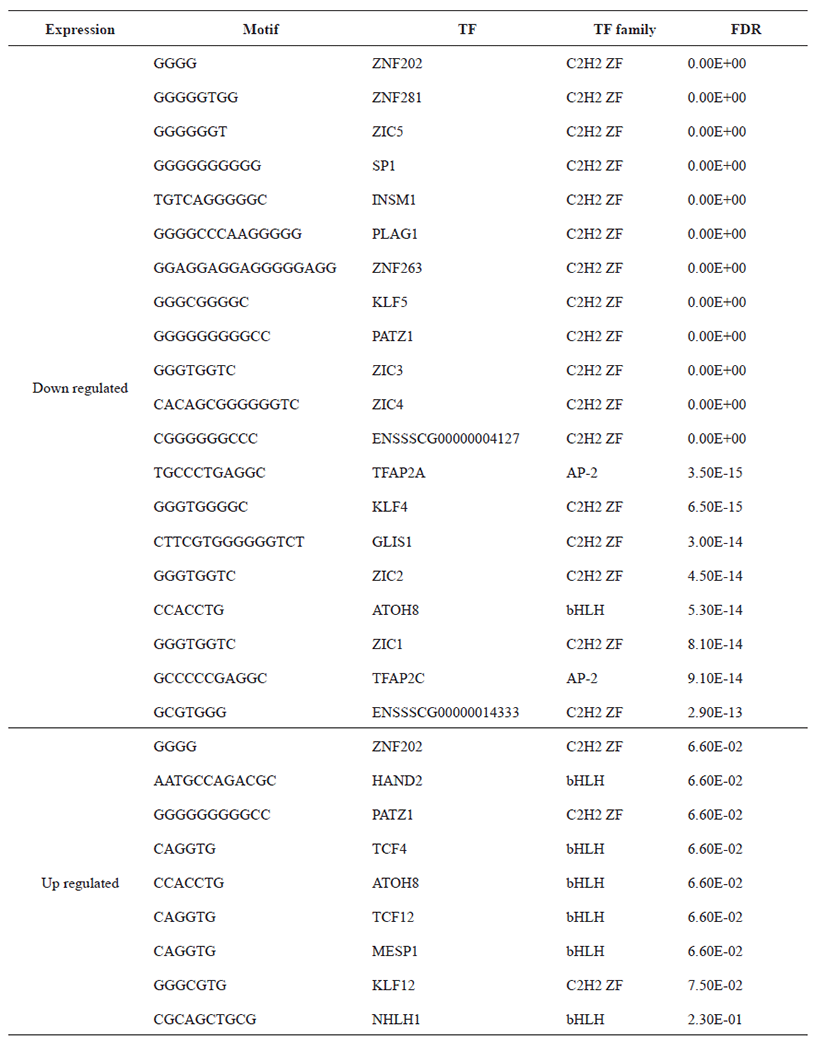
TCF4 is also responsible for lipid metabolism to reduce the fat deposition in the human body, and can interlinked with pig lipid metabolism [23]. It has been reported that the NHLH1 gene is also associated with lipid metabolism as well as neurogenesis [24]. The downregulated ZIC3 is involved in activation of zinc finger transcription factor during beginning of gastrulation [25]. Some other downregulated gene like PLAG1, that can affect the male fertility in cattle and in several species [26].
GO consists of three main components like, biological process, molecular function, and cellular component. In this study, our findings suggesting that the DE genes of porcine’s liver tissue of two stages are involved in fat and lipid metabolism. Gene enrichment analysis (at q < 0.05) of DE genes showed enrichment of multiple GO terms. We have used q value, since we have taken our gene list and compared with every single pathway that is annotated in DAVID. Genes involved in biological process (Fig. 3A) such as cell division, DNA replication, regulation of signal transduction by p53 class member, translational initiation, G1/S transition of mitotic cell cycle, nucleotide-excision repair, DNA gap filling, positive regulation of telomerase activity, protein phosphorylation, activation of GTPase activity, cellular components like kinetochore, ribosome, focal adhesion etc. and performing molecular function such as structural constituent of ribosome, Poly(A) RNA binding, DNA helicase activity, microtubule motor activity etc. were found to be enriched.
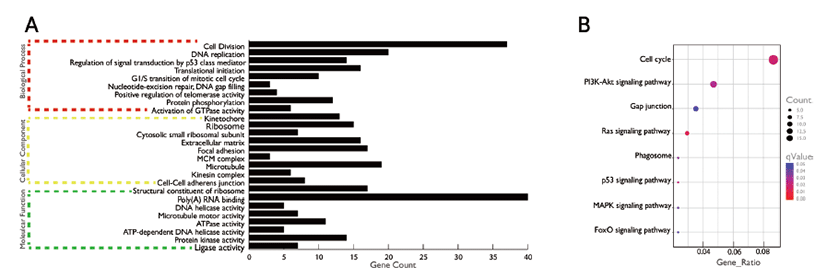
We then investigated the significantly enriched KEGG pathways (q < 0.05) and found pathways like cell cycle, P13K-Akt signaling pathway, Gap junction, Ras signaling pathway, Phagosome, p53 signaling pathway, MAPK signaling pathway, FoxO signaling pathway etc. to be significantly enriched (Fig. 3B).
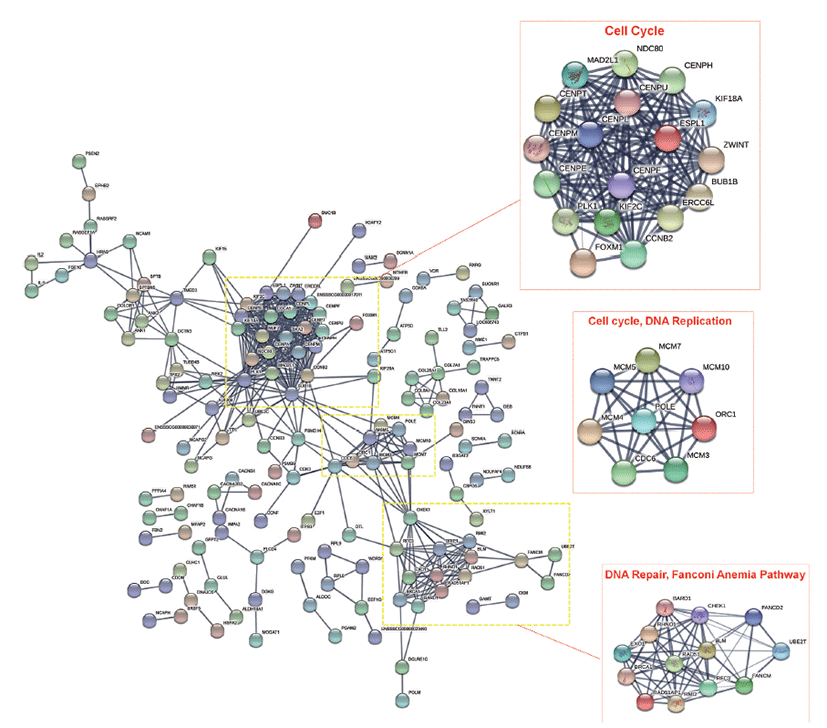
We then performed, protein-protein interaction (PPI) network analysis with the significant DEGs identified in this study using STRING database and considered the nodes as genes and the edges are the interaction between the nodes. Three clusters involving genes that functions in cell cycle, DNA replication, and DNA repair, Fanconi Anemia pathway were found to have significant interactions, as shown in Fig. 4.
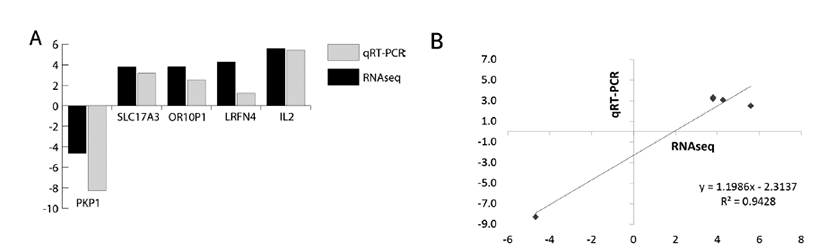
We have selected the top 5 DEGs like PKP1, SLC17A3, OR10P1, LRFN4, IL2 which are involved in fat metabolism of liver tissues of crossbred pig. The expression levels of five genes were analyzed in stage 1 vs. stage 2. As shown in Fig. 5A, qRT-PCR is also corroborating the findings of RNA-seq findings. The Fig. 5B is showing the correlation (r2) at value 0.9428 and ΔCT and LOG2FC of RNA-seq analysis. Many similar interpretations have been reported earlier for validation of DE genes through qRT-PCR [27–30].
Conclusion
This study presents the first report of liver tissues gene regulation in a cross-bred Korean pig. A detailed and comprehensive investigation of mRNAs in stage specific liver tissue may serve as a good resource for further study. By analyzing the stage specific RNA-Seq data of pig liver tissues, we showed the expression profile of mRNAs and their association with fat metabolism. Through GO, pathway and PPI analysis we found genes and TFs that are involved in fat metabolism, cell cycle, DNA repair and replication and signal transduction to be significantly enriched in stage 2 pigs relative to stage 1. However, functional genetics experiments are still needed to validate the functional association of mRNAs presented in this study.