Introduction
Caffeic acid-derivatives belong to the phenolic acid family and are abundant in fruits and vegetables. Over the past years, several studies have shown that phenolic acid compounds act as potent antioxidants by scavenging free radicals and enhancing the cell stress response through the up-regulation of cytoprotective systems, including heme oxygenase-1, heat shock protein 70, extracellular signal-regulated kinase 1/2 and the protooncogene Akt [1]. Furthermore, phenolic acids were shown to inhibit the expression and activity of cytotoxic enzymes, including inducible nitric oxide synthase, caspases and cyclooxygenase-2 [1].
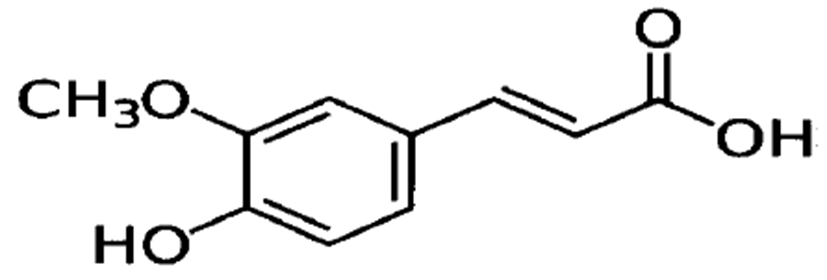
Ferulic acid [(E)-3-(4-hydroxy-3-mehtoxy-phenyl) prop-2-enoic acid] (Fig. 1) is a caffeic acid derivative, widely found in vegetables, fruits and Chinese medicinal herbs [2]. In particular, ferulic acid has been proposed as a potential treatment for many disorders including Alzheimer’s disease [3, 4], cancer [5, 6], cardiovascular diseases [7, 8], diabetes mellitus [9] and skin disease [10]. Despite the abundance of preclinical research, few pharmacokinetic studies have been carried out in animals and humans.
The antioxidant properties of ferulic acid are currently being investigated in clinical trials. Recent ferulic acid pharmacokinetic studies use high performance liquid chromatography (HPLC)/mass spectrometry (MS) analysis [11, 12]. The studies were focused on ferulic acid plasma levels [13-16]. However, accurate pharmacokinetic analyses of ferulic acid have not yet been reported. Therefore, we have investigated the pharmacokinetics of ferulic acid after intravenous (i.v.) bolus administration in rats. The pharmacokinetic parameters after i.v. bolus administrations were determined. Furthermore, the elimination of ferulic acid by the biliary and urinary systems and the tissue distribution were determined. To analyze ferulic acid levels in biological samples, we used a simple HPLC-based method that was developed and validated in our laboratory.
Materials and Methods
Ferulic acid and caffeic acid were purchased from Sigma- Aldrich (St. Louis, MO, USA). Solvents used in the analysis were of HPLC grade, filtered and degassed just prior to use. All other chemicals used in this study were of analytical reagent grade.
Adult male Sprague Dawley rats weighing 230~250 g (Samtako Co. Ltd., Kyunggi, Korea) were used for pharmacokinetic studies. They were housed in individual metabolic cages during and after administration of ferulic acid. The animals were maintained under a 12 hr light/ dark cycle with free access to water.
Ferulic acid levels were assayed by reverse phase HPLC on a Luna C18 column (Phenomenex, 4.6 mm × 250 mm, 5 μm), interfaced with a Jasco HPLC system. This system consists of a model PU-980 pump, a model AS-950-10 autoinjector, an UV-VIS detector, and a LCNet II control borwin integrator (Jasco Co. Ltd., Tokyo, Japan). The mobile phase was a mixture (pH=2.8) of methanol and water (45:55 v/v%). The flow rate was 0.7 mL/min. The ferulic acid elutes were monitored spectrophotometrically at 325 nm.
Sensitivity: The lower limit of quantification (LOQ) was defined as the lowest concentration yielding precision less than 20% (coefficients of variation, CV) and accuracy between 80 and 120% of the theoretical value.
Linearity: The linearity of the assay was assessed by preparing quality control samples containing ferulic acid at concentrations ranging from 0.05 to 100 μg/mL (0.05, 0.1, 0.5, 1, 5, 10, 50 and 100 μg/mL) and then plotting the actual versus the measured concentrations. The ferulic acid samples were prepared in plasma, urine, bile and tissue homogenates. The resulting straight-line regression equations were treated statistically (weighting factor: 1/ concentration) and are presented with their correlation coefficients.
Precision and Accuracy: The precision and accuracy of the method were determined by preparing quality control samples, five for each of the ferulic acid concentrations that range from 0.05 μg/mL to 100 μg/mL, and then assaying these samples on the same day (repeatability) and after five consecutive days (reproducibility).
Under light pentobarbital sodium anesthesia, the femoral vein and artery were cannulated with PE-50 polyethylene tubing (Intramedic, Clay Adams, NJ, USA) for ferulic acid administration and blood sampling, respectively. Ferulic acid was administered into the femoral vein at the dose of 2 and 10 mg/kg in rats. Blood was collected into heparinized tubes from the femoral artery 1, 2, 3, 4, 5, 7, 10, 15, 30, 45 and 60 min after i.v. bolus administration. The blood samples were centrifuged for 15 min at 1,500 g and plasma was harvested. Immediately after the collection of the plasma (100 μL) samples, caffeic acid (10 μL, 100 μg/mL) was added to each plasma test tube as an internal standard. Methanol (200 μL) was then added to precipitate the proteins and extract the compounds of interest. These mixtures were vortexed for 15 min and centrifuged for 15 min at 1,500 g. The supernatants (100 μL) were withdrawn for quantitative HPLC analyses.
Under light pentobarbital sodium anesthesia, the femoral vein was cannulated with PE-50 polyethylene tubing for ferulic acid administration. A catheter (PE-10, Intramedic) was then implanted into the bile duct via a small abdominal incision. Blank bile was obtained just before the administration of 2 and 10 mg/kg ferulic acid to three sets of rats via the femoral vein. Bile was collected 0~5, 5~10, 10~30, 30~45, 45~60, 60~90, 90~120 and 120~180 min after the dose was administered. Urine was collected from the metabolic cages over the 72 hr after ferulic acid administration and stored at −70℃ until HPLC analysis. The ferulic acid levels in the bile and urine were determined as described above.
The rats were decapitated at 0.5, 1 or 2 hr after i.v. bolus administration of ferulic acid at doses of 10 mg/kg, respectively. The liver, kidney, lung, heart, spleen, small intestine, large intestine, stomach, testis and muscle were immediately removed, blotted onto filter papers, and weighed. The tissues were rinsed in ice-cold 50 mM tris-HCl buffer (containing 0.25 M sucrose, pH 7.4) and homogenized with a glass Potter-Elvehjem-type homogenizer with a Teflon pestle. After extracting 100 μL of 20% homogenate with 200 μL methanol, the concentration of ferulic acid in the supernatant was measured as described above.
Plasma concentration profiles of ferulic acid after i.v. bolus administration were analyzed by fitting the data to the following biexponential equation according to the nonlinear least-squares method (MULTI): Cp=A∙e−αt + B∙e−βt. The pharmacokinetic parameters were subsequently calculated as follows: k21=(Aβ + Bα)/(A + B), kel=αβ/ k21, k12=(α + β)-(k21 + kel), t1/2α=0.693/α, and t1/2β=0.693/β, where k12 and k21 represent the rate constants of transport between the central and peripheral compartments, respectively. kel represents the elimination rate constant. t1/2α and t1/2β represent the plasma half lives at α and β phases, respectively.
Non-compartmental methods were also used to determine pharmacokinetic parameters. The area under the plasma concentration-time curve from time zero to infinity (AUC) was calculated using the equation AUC= AUCt + Ct/β, where Ct is the last quantifiable concentration. The area under the plasma concentration-time curve from time zero to the time of the last quantifiable concentration (AUCt) was calculated by linear trapezoidal approximation. The following parameters were also calculated using the standard methods: the total plasma clearance (CLt)=Dose/AUC, the steady-state volume of distribution (Vdss)=CLt∙MRT, the mean residence time (MRT)=AUMC/AUC, where AUMC represents the area under the moment curve.
Results
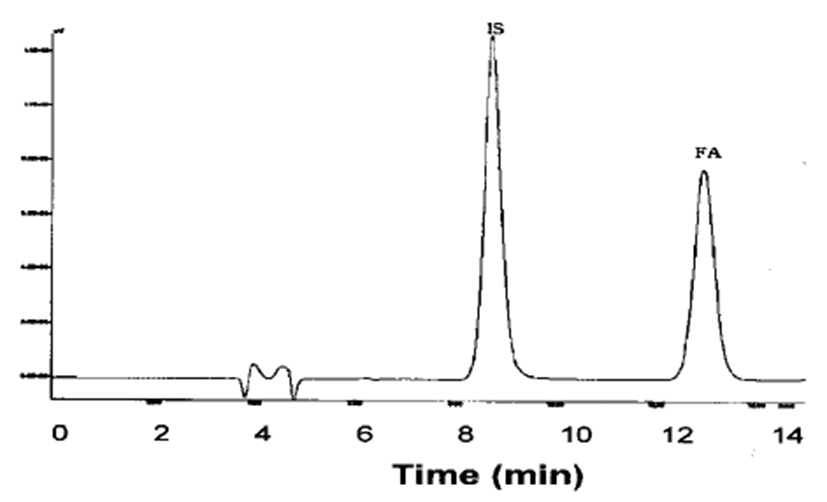
Fig. 2 illustrates a typical chromatogram of ferulic acid and the internal standard (I.S.) in plasma. The chromato- gram shows no peaks that interfere with the ferulic acid and I.S. signals. To determine the linearity of the HPLC method, quality control samples were prepared, five for each of nine concentrations, ranging from 0.05 μg/mL to 100 μg/mL. These samples were assayed on the day of preparation and on the following four consecutive days. The mean regression equation was calculated from the resulting nine calibration curves. The mean regression equation was y=0.133x − 0.0493 (r2=0.999), where y is the peak area ratio, and x is the concentration. This equation shows significant linearity (P<0.01) over the concen- tration range of 0.05~100 μg/mL. The mean regression equations for bile, urine and tissue homogenates were not significantly different from the equation for plasma.
In between-day results, variations of both precision and accuracy were always<15% (Table. 1). The same acceptance criteria were fulfilled for within-day results, which demonstrate the repeatability of the method. Therefore, the lower limit of quantification (LOQ) was defined as 0.05 μg/mL. The mean absolute recovery of ferulic acid was 95.8%.
Fig. 3 shows the rat plasma concentrations of ferulic acid over time after i.v. bolus administration at doses of 2 and 10 mg/kg. Ferulic acid rapidly disappeared from the plasma in 15 min (α phase) after i.v. administration, followed by late disappearance in β phase. The pharmacokinetic parameters of ferulic acid after i.v. administration are summarized in Table II. The mean plasma half-lives at α phase (t1/2α) when administered at the dose of 2 and 10 mg/kg were 1.10 and 1.39 min, respectively. The value of t1/2β increased 40% (from 5.02 to 7.01 min) with the dose increase from 2 to 10 mg/kg. The pharmacokinetic parameters were also determined by non-compartmental methods. The CLt values significantly decreased with the dose increase. On the other hand, Vdss values did not show significant differences with the dose increase from 2 to 10 mg/kg.
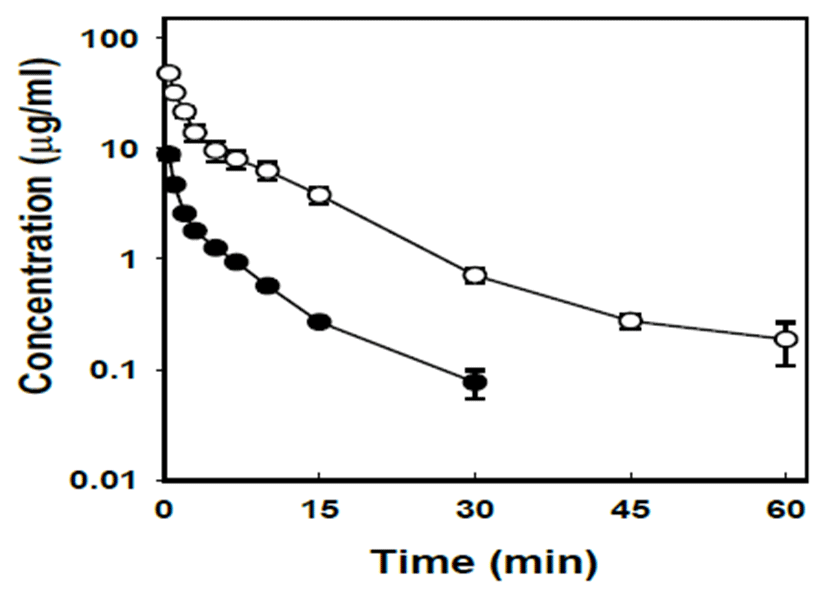
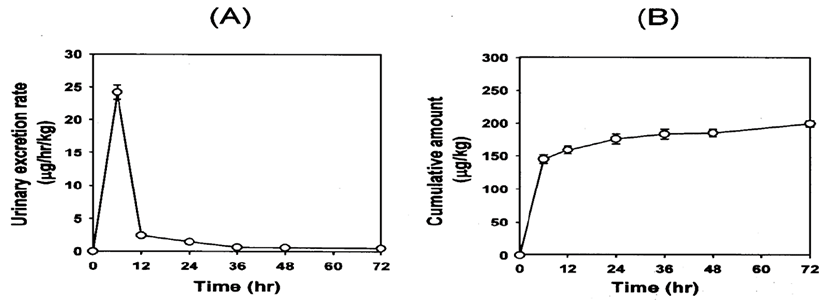
Fig. 4 shows the excretion rate and the cumulative amount of ferulic acid excreted in the bile after i.v. bolus administration at the dose of 10 mg/kg. Ferulic acid was not detected in the bile 2 hr after i.v. bolus administration. The urinary excretion of ferulic acid was maintained for up to 72 hr after i.v. bolus administration at the dose of 10 mg/kg (Fig. 5). The cumulative amounts of ferulic acid in the bile 2 hr and urine 72 hr after administering 10 mg/kg were 0.21 and 0.20 mg/kg, representing 2.1 and 2.0% of the ferulic acid that was administered, respectively. The cumulative amount of ferulic acid in the bile 2 hr after dosage was compatible with the amount excreted in the urine 72 hr, indicating that i.v. administered ferulic acid was mainly excreted in the both bile and urine.

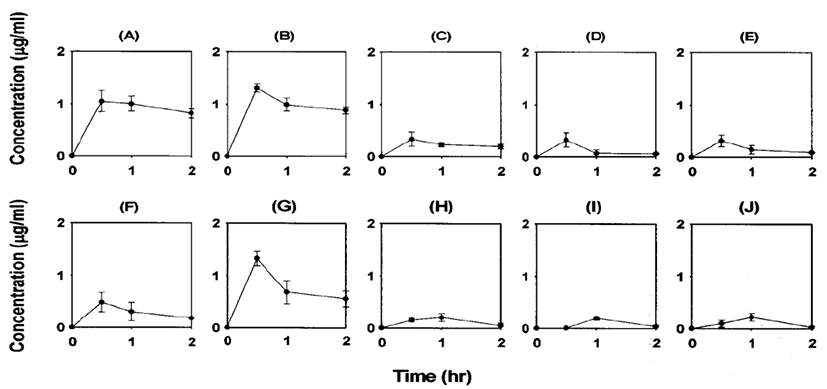
The distribution of ferulic acid in various tissues 0.5, 1 and 2 hr after i.v. bolus administration of 10 mg/kg is described in Fig. 6. Ferulic acid was mainly distributed in liver, kidney and large intestine after i.v. bolus administration. Moreover, the ferulic acid concentrations in the liver and kidney 0.5 hr after i.v. administration were 1.0 μg/g and 1.3 μg/g tissue, respectively. These values were comparable to the plasma concentration shortly after i.v. bolus administration of 10 mg/kg (Fig. 3). The ferulic acid concentrations in various tissues 2 hr after i.v. bolus administration were below 1 μg/g tissue (except kidney and liver) at the dose of 10 mg/kg.
Discussion
Ferulic acid has been proposed as a novel antioxidant agent. The therapeutic potentials of the compound in chronic diseases have been investigated in clinical trials [1] and thus, determination of its pharmacokinetic characteristics is useful information. Consequently, we investigated the pharmacokinetics of ferulic acid after i.v. bolus administration at a dose of 2~10 mg/kg. The CLt of ferulic acid decreased following a dosage increase from 2 to 10 mg/kg. The clearance of ferulic acid showed the nonlinear kinetics at the high doses of 10 mg/kg. Such nonlinearity of ferulic acid clearance may be attributable to the plasma half-life decreases, following a dosage increase from 2 to 10 mg/kg (Table 2). In addition, the saturation in the elimination process in the hepatobiliary transport or urinary excretion may be one reason for the nonlinearity of ferulic acid clearance.
Ferulic acid and other caffeic acid-derivatives showed a rapid initial decrease in the blood because of rapid transfer to tissues. Tissue concentrations were maintained at high levels for a long time [17]. Such a slow elimination of these drugs from body may be caused by their slow excretion to bile and urine [1, 17]. Caffeic acid was also rapidly cleared from the blood and transferred to tissues [18]. Tissue levels of ferulic acid, administered to rats, were highest in the liver and kidney. Higher distribution was also observed in the liver and kidney 4 hr after phenolic acid administration [17]. These tissues have the most abundant blood-supply. Hence, the results imply that phenolic acid distribution depend on the blood flow perfusion rate of the organ. In the present study, ferulic acid mainly distributed to the liver and kidney after i.v. bolus administration, as was observed with other phe nolic acids (Fig. 6). Ferulic acid concentrations in the liver or kidney 0.5 hr after i.v. bolus administration were comparable to the plasma concentration shortly after i.v. bolus administration (Fig. 3). The ferulic acid concentrations in various tissues 2 hr after i.v. bolus administration decreased to low levels (Fig. 6).
Ferulic acid was excreted largely in the bile and urine after i.v. bolus administration (Figs. 4 and 5). The amount of ferulic acid found in the bile 2 hr after the administration of 10 mg/kg ferulic acid was calculated to be 2.1% of the initial dose (Fig. 4). The corresponding value in the urine 72 hr after administration of 10 mg/kg was 2.0% of the dose (Fig. 5), which was similar to published values for phenolic acids [19]. These results indicate that ferulic acid is mostly excreted in the bile and urine. However, a low percentage (2.0~2.1%) of unmodified ferulic acid has been found (Figs. 4 and 5). Ferulic acid undergoes extensive metabolism in the liver through 1A1 and 2B7 of the UDP-glucuronosyl-transferase (UGT) [20]. Glucuronide and sulfoglucuronide are the most abundant metabolites of ferulic acid. Both ferulic acid and its metabolites are excreted mainly from the kidney, then in the bile [1, 19]. In the present study, we developed and validated a simple HPLC method to determine the ferulic acid concentration in biological samples, such as plasma, bile, urine and tissue homogenates. Our validated method is suitable for the pharmacokinetic studies in rats.


