INTRODUCTION
The explosive increase in the amount of pathological slides for diagnosis has placed a burden on pathologists. Furthermore, there has been an inconsistency in diagnostic results according to differences in the training field experience of researchers. This has made the development of novel tools capable of increasing accuracy and consistency a top priority [1]. Furthermore, the current pathological education system for biomedical researchers who need long-term training and preclinical and/or clinical experience cannot meet all of these demands [2].
Digital pathology is a sub-field of pathology that focuses on data management based on information generated from digitized specimen slides. The methods of this subfield potentially provide greater accuracy, reproducibility and standardization of pathology-based studies and preclinical and clinical trials [3].
For the preparation of digitized slides for specimens, it is common to use a digital scanner, which can generate whole slide imaging (WSI). WSI technology has advanced to a point where it has replaced the glass slide as the primary means of pathology evaluation [4]. Implementation of WSI is a multifaceted and inherently multidisciplinary endeavor requiring both contributions by pathologists and technologists, and executive leadership [5]. With the availability of WSI of tissue slides, image processing techniques have been exploited in recent decades to automate and optimize the analysis. WSI-based digital pathology has been adopted to enhance time efficiency and to reduce the cost [6], even to eliminate potentially human bias [7]. Basically, this approach has been applied to quantitative assessment of bone marrow hematopoietic lineages [8], mitosis [9] and collagenous tissue [10].
Various applications incorporating AI are being developed to assist the process of pathologic diagnosis, and detection and segmentation of specific objects [11]. Among these, deep learning achieved high performance on image classification and categorization, and it has been expanded into the field of medical image analysis [12].
The Inception-v3 model has the advantage of being able to simultaneously process multi-scale targets on multi-levels and collect feature maps with different features. Therefore, it is considered to be an efficient tool for classification [13]. Convolutional neural network (CNN)-based systems such as VGGNet or ResNet have also been proposed in medical image analysis [14].
As it is highly anticipated that automatic classification of specific cells may reduce slide reading time and the process of cell detection, AI-based analysis will be warranted in animal tissues. The purpose of this study is to classify chondrocytes in knee joints of rats and to evaluate accuracy of the results using Inception-v3 deep learning model.
MATERIALS AND METHODS
We used 15 hematoxylin and eosin (H&E)-stained slides of knee joints of normal SD female rats. The slides were retrieved from historical background data.
All slides were scanned using a Panoramic Whole-slide Scanner (3D Histotech, Budapest, Hungary) at 20 × magnification in the Department of Biomedical Laboratory Science of Namseoul University. The staining intensity, contrast, and thresholding were not adjusted.
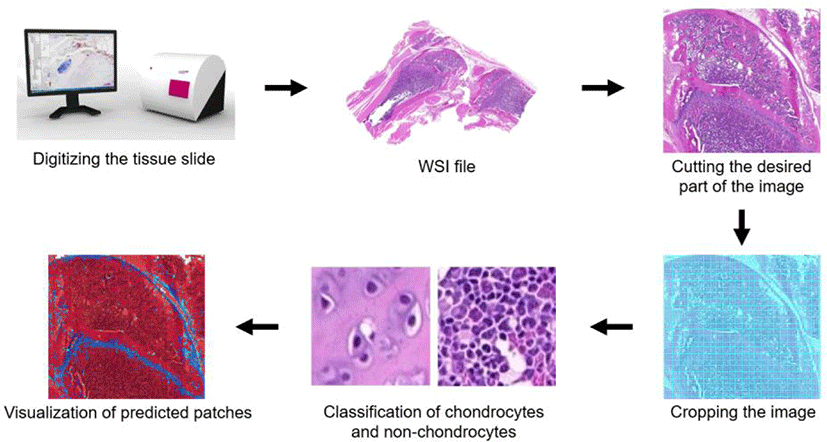
We used Inception-v3 model for training and testing, and evaluated classification accuracies. An overview of the approach is shown in Fig. 1. H&E-stained sections were scanned, converted, cropped, and used for supervised training of Inception-v3. Using this model, cropped images were classified as chondrocytes or non-chondrocytes. For assessment of Inception-v3 performance, classification accuracies were calculated.

We cropped the images of knee joint samples to 79 × 79 pixels. For computational learning of images, we divided the images into two parts as training and test set. The 65,797 images were randomly divided into training (70.4%) and test (29.6%) sets (46,349 and 19,448 images, respectively; Table 1).
| Classification | Number of training data | Number of test data |
|---|---|---|
| Chondrocytes | 2,544 | 3,550 |
| Non-chondrocytes | 43,805 | 15,898 |
| Sum | 46,349 | 19,448 |
RESULTS
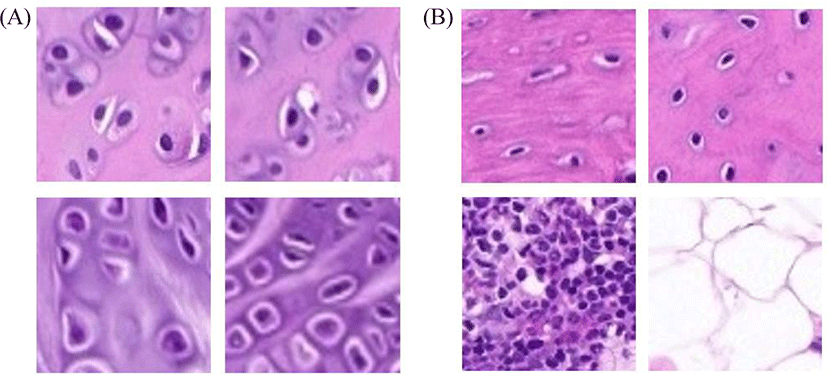
Chondrocytes and non-chondrocytes were present in knee joints from WSI profiles. We cropped the images as described above; representative images are shown in Fig. 2.

Representative chondrocytes are shown in Fig. 2A. Non-chondrocytes such as bone cells, bone marrow cells and adipocytes are shown in Fig. 2B.
Inception-v3 evaluated square patches and predicted chondrocytes and non-chondrocytes. Confusion matrix of chondrocytes and non-chondrocytes showed the accuracies were 91.20 ± 8.43% (Table 2).
| Classification | Reference data | No. of data | |
|---|---|---|---|
| Chondrocytes | Non-chondrocytes | ||
| Chondrocytes | 2,016 | 1,534 | 3,550 |
| Non-chondrocytes | 177 | 15,721 | 15,898 |
| No. of data | 2,193 | 17,255 | 19,448 |
| Accuracy (%) | 91.20 ± 8.431) | ||
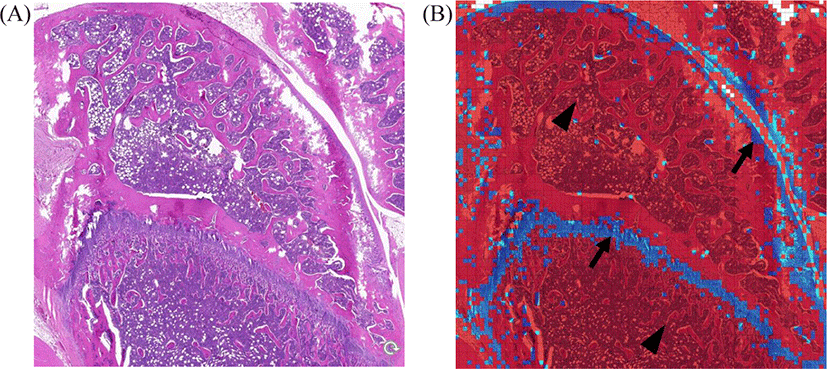
The data for knee joints are shown in Fig. 3. Representative original H&E images are shown in Fig. 3A. Inception-v3 colored chondrocytes are shown in blue and non-chondrocytes in red (Fig. 3B). Almost all chondrocytes were so identified as blue. However, a few non-chondrocytes were misclassified as chondrocytes.

Discussion
In this study, we could classify chondrocytes from H&E-stained knee joint slides of rats using Inception-v3 model, showing the accuracy as 91.20 ± 8.43%. And we confirmed this model was applicable to classify the specific cells, making it possible to achieve automated classification of chondrocytes and non-chondrocytes in H&E stained slides.
In the image sets from knee joints, some cells such as trabecular bony tissues and adipocytes were misclassified as chondrocytes. To reduce misclassification, it seems that some tissues such as trabecular bony tissues, adipocytes and megakaryocytes may be excluded prior to deep learning. It was reported that misclassification was more frequent among histologically related tissues, where morphologies were shared at higher magnification [14]. Cartilage, periosteal tissue and attached skeletal muscle were excluded from the original images for quantification of bone marrow cellularity, prior to analysis [15]. For quantification of lung fibrosis, images containing large bronchi and vessels were manually excluded from the original images [16].
As Inception-v3 model showed the effective classification when the image size was 299 × 299, 151 × 151 and 79 × 79 [13], we cropped the image sized as 79 × 79 pixel in this study. During the processing of images, it seemed that resizing images might have affected image resolution, resulting in poor image quality, which might be related to low accuracy. For higher resolution, image resizing could be minimized and an image editor that can handle large-capacity images should be prepared.
In this study, the staining intensity, contrast and threshold were not adjusted, because it might induce potential artifact or possible processing noise during processing of images. For detection of tissue components, it is important to retain careful control of algorithm, image size, staining procedures and so on. Considering the time and manual labor needed for image processing, it is highly recommended to develop a commercial and user-friendly deep learning algorithm. This will provide opportunities for pathologists to use deep learning-based applications to save time and improve reading quality [17].
Taken together, we confirmed that Inception-v3 was applicable to classify rat chondrocytes and non-chondrocytes in knee joints in H&E stained slides. This promising approach will allow the rapid and accurate analysis of tissue characteristics including chondrocytes.