INTRODUCTION
Periodontal disease is a chronic condition characterized by alveolar bone loss which affects more than 30% of Korean adults aged 30 years or older. According to the 2020 Health Insurance Review and Assessment Service frequent disease statistics, periodontal disease was the main reason for visiting the out-patient department and ranked first in terms of the total cost of medical care benefits. If periodontal disease is not treated in time, it can lead to tooth loss by exacerbating inflammation of the surrounding supportive tissue [1]. Periodontal disease is caused by bacterial infection, with the development and progression of plaque formation and inflammation being dependent on multiple individual, genetic, social, and environmental factors [2]. Periodontal disease is one of the factors directly related to quality of life, and it has been suggested that the risk of quality-of-life deterioration is 1.32 times higher in the periodontal disease group than in the healthy periodontal group [3]. In uncontrolled periodontal disease inflammation can become chronic, in turn increasing risk for other illnesses such as heart disease, ocular disorders, and pulmonary fibrosis [4–7]. Several studies have examined the socio-economic and population-based factors thought to influence risk for periodontal disease in Korean adults [8–10].
The Korea National Health and Nutrition Examination Survey (KNHANES) is a nationwide health and nutrition survey conducted in accordance with Article 16 of the National Health Promotion Act. For the KNHANES, data were collected through demographic factors, medical examination results, and nutritional intake. Many studies using KNHANES data to examine periodontal disease in the Korean population have also been conducted. In a study using data from the 4th KNHANES, a complex sample logistic regression analysis was performed to confirm the effects of different predictors on the stage-related prevalence of periodontal disease. Efforts to resolve social and economic inequalities have also been made [11]. Research has also shown that the metabolic syndrome is associated with an elevated risk for periodontal disease, which increases in parallel with the number of metabolic syndrome features present [12]. Therefore, the severity of dyslipidemia, including low high-density lipoprotein (HDL), high low-density lipoprotein (LDL) cholesterol, and elevated triglycerides, is correlated with the severity of periodontal disease [13, 14]. In a study comparing the prevalence of periodontal disease based on oral health behaviors using data from the 6th KNHANES 3rd year (2015), statistically significant differences were found in periodontal disease treatment, tooth brushing time, dental floss, interdental brush use and subjective oral health status [15]. In one study, age, sex, body mass index (BMI), and lipid profiles were examined in 45 patients with periodontitis. Total cholesterol and triglyceride levels were higher in the periodontitis group, and HDL and LDL cholesterol levels were high in the case group. However, these differences were not statistically significant [16]. Other studies using multiple logistic regression analysis have identified hypertension, but not type II diabetes mellitus, heart disease, dyslipidemia, or anemia, as a risk factor for periodontal disease [17, 18]. In studies using decision trees, logistic regression analysis, and artificial neural networks to develop prediction models for periodontal disease, decision trees have shown the highest accuracy [19, 20]. To solve the class imbalance of categorical variables, machine learning algorithms have been used, and various methods have been used to evaluate the performance of predictive models [21–23].
Most of these previous studies dealt only with the relationship between some risk factors and periodontal disease, and studies that applied various machine learning algorithms to build predictive models are insufficient. In response to this knowledge gap, the aim of this study was to develop and compare different risk prediction models for periodontal disease using machine learning algorithms based on data obtained from the 6th KNHANES survey [24]. The ultimate goal of this study was to improve the quality of care and reduce healthcare costs for patients with periodontal disease through improved detection and treatment of important clinical risk factors.
MATERIALS AND METHODS
We extracted raw data from the 6th KNHANES, conducted from 2013 to 2015. The total number of households surveyed was 22,948, and we considered a total of 655 variables of interest. The analysis was performed using data from 11,102 participants who completed pre-processing.
In this study, we selected demographic, health behavior-related, and oral-health related variables associated with periodontal disease in previous studies [25].
Demographic characteristics included area of residence, sex, age, private health insurance subscription, household income, number of household members, basic livelihood benefits, housing ownership, marital status, health insurance type, education level, and economic activity status. Health behavior-related characteristics included a history of hypertension, dyslipidemia, stroke, myocardial infarction, angina pectoris, type II diabetes mellitus, obesity, subjective health status, history of health check-ups, subjective body type recognition, lifetime history of alcohol use, lifetime smoking status, average hours of sleep per day, systolic blood pressure, diastolic blood pressure, BMI, serum fasting blood glucose, glycated hemoglobin, lipid profiles, aspartate aminotransferase, alanine aminotransferase, and leukocyte levels, as well as urinalysis for proteins, glucose, ketones, and bilirubin [26, 27].
For oral health characteristics, we considered the use of permanent dental caries, perceived oral health status, experience of toothache over the past year, orthodontic treatment experience, chewing problems, complaints of chewing discomfort, speaking problems, and daily dental hygiene habits. In keeping with other studies, we selected the number of brushing times and the number of oral products used as variables of interest.
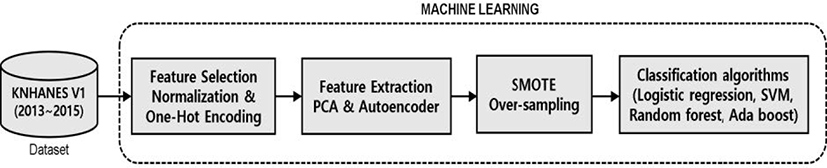
Fig. 1 summarizes the overall process used for the classification and analysis of the risk factors for periodontal disease extracted from the database. To optimize statistical analysis of the data, outliers and missing values were removed. The refined dataset that was subjected to pre-processing process included 11,102 samples and 54 data sets, which together examined 15 numerical variables of interest, including average sleep time, systolic blood pressure, and BMI, as well as 39 categorical variables of interest, including gender income, and education level. MinMaxScaler was used to normalize numerical data. In the AdaBoost model for categorical data, one-hot encoding was performed to apply a deep learning model.
The periodontal disease risk factor data were extracted using principal component analysis (PCA) and an auto-encoder. Variable extraction is a technique for creating new variables by combining existing ones. It is different from the random selection of isolated variables of interest. PCA is a technique that converts a new variable from a high-dimensional variable into a low-dimensional variable without linear correlation by linearly combining the data while preserving the variance as much as possible.
An auto-encoder is a kind of artificial network used for unsupervised machine learning. It consists of two parts: an encoder that transforms the input into an internal representation, and a decoder that transforms the internal representation into an output. Except for the number of neurons in the input and output layers being the same, an autoencoder (AE) has the same structure as a general multilayer perceptron.
Autoencoder reduces the dimension by compressing data by making the number of neurons in the input and output layers the same and making the number of neurons in the hidden layer smaller than the input layer. Stacked autoencoder forms a network by stacking as many stacks as the number determined by the designer in advance. The network formed in this way can extract important features from the input data. In this study, a stacked auto-encoder, i.e., one with several symmetrical hidden layers, was used. A layered auto-encoder has the advantage of being able to learn more complex features by adding layers. In addition, we used a synthetic minority oversampling technique (SMOTE) algorithm to solve the data imbalance. SMOTE is a commonly used oversampling technique for generating synthetic data. Oversampling was applied to adjust the unbalanced data so that the ratio of the data was 1:1. As a result of oversampling, 7,549 cases (50.38%) with periodontal disease and 7,434 cases (49.62%) without periodontal disease were corrected. To implement the periodontal disease classification model, data for learning were divided into 70%, and data for verification were divided into 30%. The learning data consisted of 50.15% cases without periodontal disease and 49.85% cases with periodontal disease, and the validation data consisted of 50.93% cases without periodontal disease and 49.07% cases with periodontal disease.
We used a combination of logistic regression analysis, support vector machine (SVM) learning, random forest, and AdaBoost to classify risk prediction models for periodontal disease. Logistic regression analysis is a statistical technique in which the effects of multiple predictors on which a binary dependent outcome is estimated using a binomial or ordinal polynomial logistic function. The optimal model was backward elimination according to standard criteria. SVM performs classification in the direction with the highest margin. The larger the margin, the higher the classification performance when new data not used for training are used for input. Extending the dimension of non-linear data has the advantages of linear separation, less impact on erroneous data, and less tendency to overfit data when compared to other models. Random forest is an ensemble machine learning model used for classification and regression analysis. It is a machine learning technique proposed by Breiman (2001) to randomly select an optimal reference variable. Random forest easily handles missing data and is effective for processing large amounts of data. In addition, model accuracy can be improved by avoiding overfitting of the data, and it is possible to select relatively important variables in the classification model. AdaBoost is a type of boosting algorithm that sequentially learns and predicts several weak learners, and extracts features that improve model performance during the training process by assigning weights to incorrectly predicted data to improve errors. In the learning process, each sample is weighted, and the processing speed is increased by adapting previously unprocessed samples to the next learning phase through modelling. To evaluate the test data, the data were divided in a 70:30 ratio, with 7,771 cases in the training set and 3,331 cases in the test set. The results derived from machine learning were evaluated based on the accuracy, precision, recall, and F1 score of the confusion matrix. Statistical analyses were performed using the R (version 4.0.5), Jupyter Notebook, and Python (version 4.1) software packages.
Results
The demographic, health behavior-related, and oral health characteristics of the participants are shown in Tables 1 to 3 below. The demographic characteristics of participants with and without periodontal disease were compared (Table 1). Experiments with the chi-square test showed significant between group differences with respect to gender, age, education level, economic activity, and periodontal disease. Only a minority of participants had a known diagnosis of hypertension, dyslipidemia, stroke, myocardial infarction, angina pectoris, or type II diabetes mellitus. In total, 32.89% of participants were classified as obese. In total, 51.67% of the respondents considered their health to be “normal”, while 65.56% of the respondents had previously received a health checkup. In total, 41.11% of respondents reported normal subjective body type recognition, 89.24% of respondents had a lifetime history of alcohol consumption, 59.75% of respondents had never smoked, and 82.77% of respondents had HDL cholesterol levels within the normal range. Urinary protein, sugar, bilirubin, and ketones were absent in 93.15%, 96.71%, 96.24%, and 94.54% of patients, respectively.
The health behaviors of patients with and without periodontal disease were compared, as summarized in Table 2. There were significant between-group differences evident for all variables of interest, including blood pressure, hyperlipidemia, heart disease, type II diabetes mellitus, health check-up status, history of alcohol consumption, smoking history, and HDL cholesterol level.
Regarding the oral characteristics of the study participants, 41.79% of the respondents described their perceived oral status as “normal”, 61.32% of the respondents had not experienced toothache over the past year, and 94.51% of the respondents did not receive orthodontic treatment or have chewing problems. Int total, 36.63% of the respondents said that they were “not at all uncomfortable” with their health. In this subgroup, 98.93% had brushed their teeth the previous day, 68.26% said they had no history of periodontal disease, and 72.01% said they had no permanent dental caries.
The oral characteristics of the study participants with and without periodontal disease were compared, as shown in Table 3. Variables such as oral health status, toothache experience in the past year, chewing problems, speech problems, brushing yesterday, and permanent tooth decay were significantly associated with the presence or absence of periodontal disease.
Following the extraction of significant variables related to periodontal disease, the classification performance of the model was predicted using a machine learning algorithm. PCA revealed four main components which explained 60.23% of the total data (Table 4). The first principal component had a strong relationship with the region, and the second principal component was related to education level and chewing problems. The third principal component was related to chewing problems, BMI, and ALT (SGPT), and the fourth principal component was related to chewing problems and the number of household members. The performance of the classification models was compared according to the presence or absence of periodontal disease (Table 5). Based on the classification performance results, the accuracy, precision, and recall of the logistic regression model were 0.73, 0.77, and 0.87, respectively, and the F1 score was 0.82. The model with the number of dimensions reduced using PCA was derived to have an accuracy, precision, and recall of 0.7, 0.73, and 0.89, respectively, and the F1 score was 0.8. The recall thus increased when all significant variables were included in the model. In the model that resolved the class imbalance using PCA and SMOTE, accuracy, precision, and recall were 0.67, 0.68, and 0.68, respectively, and the F1 score was 0.68. In the model reduced by applying the auto-encoder, accuracy, precision, and recall were 0.62, 0.68, and 0.84, respectively, and the F1 score was 0.75. When the class imbalance was resolved using an auto-encoder and SMOTE, the accuracy, precision, and recall of the model were 0.50, 0.51, and 0.54, respectively, and the F1 score was 0.52.
| PC1 | PC2 | PC3 | PC4 | |
|---|---|---|---|---|
| Standard deviation | 4.53350 | 2.07233 | 1.68388 | 1.32427 |
| Proportion of variance | 0.42050 | 0.08787 | 0.05801 | 0.03588 |
| Cumulative proportion | 0.42050 | 0.50837 | 0.56639 | 0.60227 |
The accuracy, precision and recall of the SVM model were 0.71, 0.75, and 0.86, respectively, and the F1 score was 0.8. In particular, the accuracies of the model with reduced dimensions obtained by applying PCA were 0.71, 0.73, and 0.93, respectively, and the F1 score was 0.81. The recall and F1 scores of the model using PCA were more accurate compared to those using all selected variables. The accuracy, precision, and recall of the model that resolved the class imbalance using PCA and SMOTE were 0.61, 0.60, and 0.70, respectively, and the F1 score was 0.65. The accuracy, precision, and recall of the model reduced using the auto-encoder were 0.61, 0.68, and 0.82, respectively, and the F1 score was 0.74. The accuracy, precision, and recall of the model that solved the class imbalance using an auto-encoder and SMOTE were 0.50, 0.51, and 0.68, respectively, and the F1 score was 0.58.
In the random forest model, the accuracy, precision, and recall were 0.72, 0.75, and 0.90, respectively, and the F1 score was 0.82. The accuracy, precision, and recall of the reduced-dimensional model by applying PCA were 0.70, 0.75, and 0.85, respectively, and the F1 score was 0.79. The accuracy, precision, and recall of the model that resolved the class imbalance using PCA and SMOTE were 0.64, 0.61, and 0.81, respectively, and the F1 score was 0.7. The accuracies of the dimensionally reduced model obtained by applying the auto-encoder were 0.59, 0.67, and 0.76 respectively, and the F1 score was 0.72. The accuracy, precision, and recall of the model that resolved the class imbalance using the auto-encoder and SMOTE were 0.49, 0.50, and 0.73, respectively, and the F1 score was 0.60.
The accuracy, precision, and recall of the AdaBoost model using the extracted variables were 0.70, 0.70, and 0.98, respectively, and the F1 score was 0.82. The accuracy, precision, and recall of the model by applying PCA were 0.70, 0.72, and 0.94, respectively, and the F1 score was 0.81. The accuracy, precision, and recall of the model that resolved the class imbalance using PCA and SMOTE were 0.68, 0.65, and 0.72, respectively, and the F1 score was 0.69. The accuracy, precision, and recall of the auto-encoder-applied model were 0.61, 0.32, and 0.19, respectively, and the F1 score was 0.24. The accuracies of the model to which the auto-encoder and SMOTE were applied were 0.49, 0.48, and 0.43, respectively, and the F1 score was 0.46.
Among the models used, the model with the highest accuracy was the one to which variable selection was applied. In the case of the model using PCA, recall increased in the model to which logistic regression analysis and SVM were applied. In the case of SVM, both recall and F1 scores showed the highest performance. Additionally, the model in which PCA was applied to AdaBoost was evaluated as having the highest precision.
DISCUSSION
In this study, we extracted data on risk factors for periodontal disease from the 6th KNHANES, and developed risk prediction models for periodontal disease using logistic regression, SVM, random forest, and AdaBoost algorithms. We performed dimensionality reduction using PCA and a stacked auto-encoder, and data imbalance was dealt with using the SMOTE oversampling technique to improve the performance of the model. However, feature extraction using a deep-learning-based auto-encoder showed a lower performance compared to other feature extraction techniques. This was related to oversampling owing to the class imbalance problem.
In this study, the risk prediction models for periodontal disease were evaluated based on a confusion matrix for a comparative analysis of machine learning algorithms. Logistic regression analysis provided the model with the greatest accuracy and precision, while AdaBoost provided the model with the highest recall value. The F1 score value increased in the model to which PCA was applied compared to the model to which variable selection was applied using SVM. Based on these results, it will be possible to use feature extraction techniques and machine learning algorithms to analyze various medical data and help medical professionals prevent and predict periodontal disease.
Although various studies on periodontal disease have been conducted, they are hampered by problems with data quality, such as poor data pre-processing or an imbalance in the target data. Because these problems degrade the performance of risk classification and prediction models, there is a need for various methods to purify and argue data. In addition, a more systematic method is required for the extraction of risk factors to develop risk prediction models. To solve this problem, we are conducting research on classification prediction models, such as feature extraction and multi-layer perceptron, using deep learning algorithms.
There are two difficulties in analyzing data on periodontal disease obtained from the KNHANES. First, there is the problem of class imbalance in the dataset. Although this imbalance was resolved by applying oversampling using the SMOTE technique, the performance of the model indeed deteriorated. In the process of oversampling data, we think underfitting might be involved, because it fails to learn useful data that affects risk prediction in a meaningful way. In future research, instead of SMOTE, a type of generation model called an auto-encoder will be applied to generate and apply a synthetic dataset close to the actual data. Second, it is difficult to reduce dimensionality using an auto-encoder. Although we scaled down the dimensions, we observed a problem with the dramatic drop in the performance of the model. In future research, we aim to apply a deep learning-based predictive model that designs input and output layers in a more diversified manner in order to compare, analyze, and improve model performance.