Introduction
The first mammalian Runt domain transcription factor (RUNX) gene was cloned and its association with human disease was revealed in 1991 [1]. During the past two decades, studies have investigated the function, structural elements, genetic variants, and roles in normal development and pathological conditions of the RUNX family [2]. In mammals, there are three RUNX genes, RUNX1, RUNX2, and RUNX3, and RUNX proteins are well conserved among many different species.
RUNX3 is the least well characterized of the three family members. Nevertheless, the role of RUNX3 as a key regulator in essential biological pathways has been reported. Diverse RUNX3-deficiency models have shown that inactivation of RUNX3, as tumor suppressor, promotes tumorigenesis in many tissues. The loss of RUNX3 expression is causally linked to the genesis of human gastric cancer [3]. RUNX3 inactivation independently induced intestinal adenomas by attenuating Wnt signaling, and lung adenomas via K-RAS mutations [4, 5]. Moreover, RUNX3 is a key regulator in the response of hypoxia and immune cell infiltration into the tumor microenvironment [6]. In mice, the conditional knockout (KO) of Runx3 resulted in the mice developing a myeloproliferative disorder, and RUNX3-deficient cells showed hypersensitivity to granulocyte-colony stimulating factor [7]. In our model, Runx3 null mice die soon after birth, often from starvation, because of multiple gastrointestinal organ defects, such as hypertrophic intestinal and stomach walls [3, 8, 9], although other organ defects have been reported. Although the functions of RUNX3 have been reported in diverse RUNX3-deficient models, the protein expression fingerprint associated with RUNX3 deficiency, which would provide clues to RUNX3-related molecular mechanisms, is incompletely understood. Additionally, to analyze phenotypes at the adult stage is difficult using our model, because Runx3 null mice show early lethality; however, it is possible to study the cellular profiles of RUNX3 in early developmental stages by establishing a Runx3 null mouse embryonic stem cell (mESC) line. Thus, in the present study, we measured the dynamics of protein expression in Runx3 KO mESCs based on comparative quantified proteomics coupled with a stable isotope labeling by amino acids (SILAC) based-metabolic labeling system.
Materials and Methods
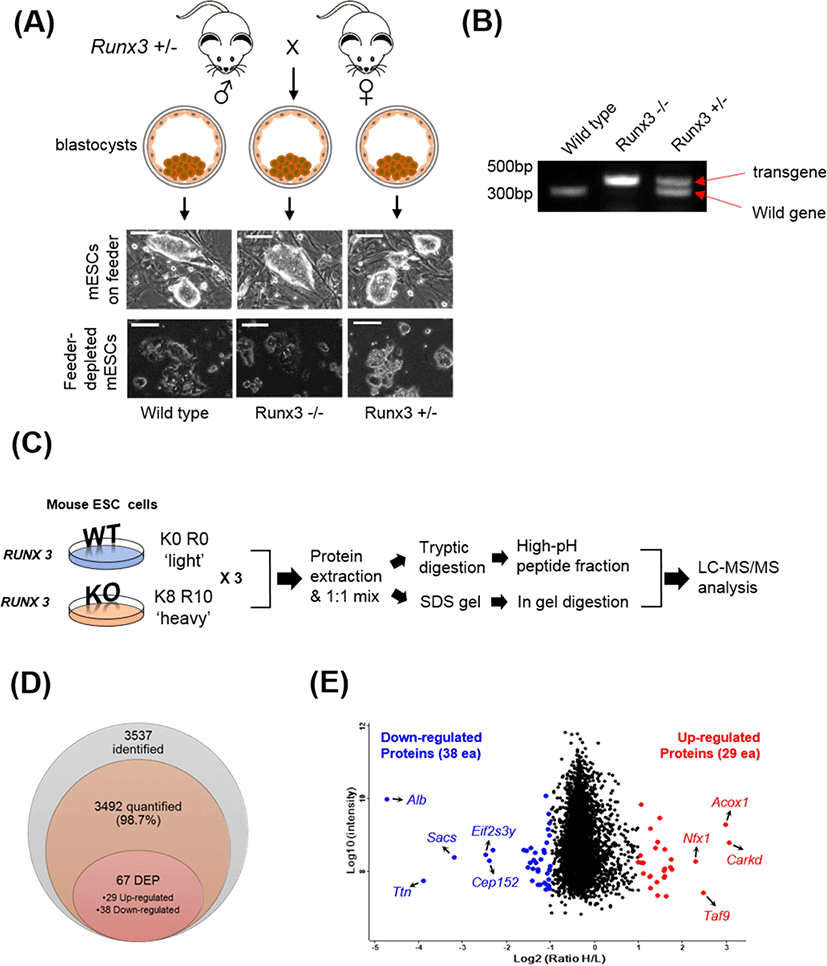
To generate a Runx3 KO mESC line, male and female Runx3 heterozygous (+/−) mice were mated. On day 3.5 of pregnancy, the female mouse was sacrificed and the blastocysts were flushed from the uterine horns using M2 medium (Sigma-Aldrich, St. Louis, MO, USA). After washing with M2 medium, the zona pellucida was removed using acidic Tyrode’s Solution (Sigma-Aldrich). After washing, the blastocysts were plated onto a mouse embryonic fibroblast (MEF) feeder layer. After 7 days, the inner cell mass (ICM) outgrowth was physically removed from the surrounding trophoblast cells and transferred to a drop of Accutase (Sigma-Aldrich) and incubated at 37°C for 20 min. ICM outgrowths were dissociated into small cell clumps of 5–10 cells using mechanical force with P200 pipette. The cell clumps from each ICM outgrowth were transferred into separate wells of a MEF-plated 12-well plate containing mESC culture medium [Dulbecco’s modified Eagle’s medium (DMEM; Invitrogen) supplemented with 1% penicillin and streptomycin (Invitrogen), 2 mM L-glutamine (Invitrogen), 0.1 mM non-essential amino acid (MEM-NEAA; Invitrogen), 1 mM sodium pyruvate (Invitrogen), 0.1 mM 2-mercaptoethanol (Sigma), 10 μg/mL leukemia inhibitory factor (LIF), and 15% knock-out serum replacement (KO-SR; Invitrogen)] supplemented 10 μM Y-27632 (a selective p160ROCK inhibitor) for 4 days. mESCs were maintained and subcultured every 3–4 days in mESC medium without Y-27632. To deplete the feeder cells, mESC colonies of each line were manually picked up and dissociated into single cells using 0.25% trypsin-EDTA (Invitrogen). Dissociated cells were plated on 0.2% gelatin-coated culture dishes containing mESC culture medium supplemented with 20 μg/mL LIF. After expansion and feeder depletion of the mESCs, the presence or absence of the wild-type gene was confirmed using genomic DNA PCR analysis (Fig. 1A and 1B).

Feeder-depleted Runx3 wild-type cells (light control) were grown in DMEM without isotopes and supplemented with 1% penicillin and streptomycin, 2 mM L-glutamine, 0.1 mM non-essential amino acid, 1 mM sodium pyruvate, 0.1 mM 2-mercaptoethanol, 20 μg/mL LIF, and 15% KO-SR. In addition, Feeder-depleted Runx3 KO mESCs were labeled with heavy amino acids by five passages of growth in SILAC medium comprising DMEM with 100 mg/L L-lysine-13C6-15N2 and 100 mg/L L-arginine-13C6-15N4 (Cambridge Isotope Laboratories, Andover, MA, USA) supplemented with 1% penicillin and streptomycin, 2 mM L-glutamine, 0.1 mM non-essential amino acid, 1 mM sodium pyruvate, 0.1 mM 2-mercaptoethanol, 20 μg/mL LIF, and 15% KO-SR. The labeling efficiency of heavy lysine and arginine was at least 95% (data not shown).
The SILAC-treated cells were lysed using radioimmunoprecipitation assay (RIPA) buffer (25 mM Tris-HCl pH 7.6, 150 mM NaCl, 1% NP-40, 1% sodium deoxycholate, 0.1% SDS) and sonication for 5 sec (six times) on ice. Extracted proteins were precisely measured using a BCA protein assay kit (Thermo Fisher scientific, Waltham, MA, USA). For the SILAC experiments, proteins from heavy labeled Runx3 (−/−) and un-labeled (light) wild-type were combined in equal amounts. To carry out reduction and alkylation, samples were incubated with 15 mM DL-dithiothreitol (DTT) at 57°C for 30 min. Then, 60 mM iodoacetamide (IAA) was added to proteins and incubated for 30 min in dark. Four volumes of ice-cold acetone was then added to the proteins to remove the detergent and incubated for 4 h at −20°C. After centrifugation at 14,000×g for 10 min at 4°C, the supernatant was discarded and the pellet was washed twice with ice-cold acetone. The purified proteins were resuspended in 100 mM Triethylammonium bicarbonate (TEAB) buffer and subjected to trypsin digestion at 37°C for 16 h. Peptides were dried using a speed vacuum system and dissolved in water with 0.1% formic acid. To separate the peptides, a High pH Reversed-Phase Peptide Fractionation Kit (Thermo Fisher Scientific) was used according to the manufacturer’s protocol.
In addition to increasing number of proteins for the deep proteomics approach, we applied in-gel digestion as another fractionation step, following a method detailed in a previous publication [10]. Briefly, we performed SDS-PAGE with mixed proteins and then stained the gel using colloidal Coomassie blue staining solution (National Diagnostics, Atlanta, GA, USA). We divided the gel into seven equal pieces, which were reduced and alkylated using DTT and IAA, respectively. Finally, the gel pieces were digested by trypsin at 37°C overnight. Peptides extracted from gel were dried using the speed vacuum system. Total fractionated samples were desalted using a C18 Ziptip and dried completely using the speed vacuum system.
The digested peptides were dissolved in solution A (2% acetonitrile in 0.1% formic acid). We then analyzed the samples using a high resolution Q-Exactive Hybrid Quadrupole-Orbitrap™ Mass Spectrometer (Thermo Fisher Scientific) connected with an EASY-nLC 1000 liquid chromatography system (Thermo Fisher Scientific). The samples were loaded into a homemade C12 column (Proteo C12 4 μm beads, 90-Å pore size, Phenomenex, Torrance, CA, USA) and separated using 2%–24% solution B (100% Acetonitrile with 0.1% formic acid) for 45 min and then with 24%–90% solution B for 15 min at 200 nL/min. Mass spectrometry (MS) data were acquired using following parameters: A scan range of 300 to 1,400 m/z, using a lock mass at 445.12002 (+); for full MS, 70,000 resolution, 3e6 AGC target, and 50 ms maximum IT, as well as 25 sec dynamic exclusion; for the MS/MS spectra, 17,500 resolution, 1e5 AGC target, 75 ms maximum IT, and the top 15 data-dependent mode with 27 NCE.
MS data were analyzed using MaxQuant 1.4.1.2 against the UniProt mouse database (with includes 51,444 protein sequences) to identity and quantify the proteins [11]. The search parameters were as follows: Trypsin as the enzyme was applied with two missed cleavages; mass tolerances of 7 ppm and 20 ppm for fragment mass deviation; Carbamidomethyl at Cys (57.021 Da) as a fixed modification; however, oxidation at Met (15.995 Da) and protein N-terminal acetylation (42.011 Da) were set as variable modifications. For the SILAC quantified ratio, heavy labeled means 13C6-15N2 labeled lysine (8.014 Da), and 13C6-15N4 labeled arginine (10.008 Da). All pair-wise protein ratios were calculated between Runx3 KO vs. control with a minimum ratio count of two. All other parameters in MaxQuant were set to default values. To select potential unique proteins, identified proteins were filtered for a false discovery rate (FDR) less than 1%, and contaminants and those only represents by 1 peptide/protein were removed. Also, visualization using a scatter plot and the calculation of the Pearson correlation were performed using Perseus 1.6.
Analysis of Gene Ontology (GO) and InterPro enrichment were performed on the up and downregulated proteins via the web-based algorithm, David 6.8, according to a previously described procedure [12]. Furthermore, we conducted protein-protein interaction analysis of the differentially expressed proteins (DEPs) using STRING 10.5 [13]. The default parameters in David and STRING were used.
Results and Discussion
To investigate the changed protein profile induced by Runx3 KO in mESCs, we established Runx3 KO mESC lines (Fig. 1A and 1B). We cultured the mESCs in the presence of light (Lys-0 and Arg-0) wild-type (WT) cells or heavy lysine (Lys-8) and arginine (Arg-10) for KO cells for SILAC-based quantitative proteomic analysis (Fig. 1C). The SILAC cell lysates were mixed in equal amounts and digested into peptides using trypsin. After fractionation of the tryptic peptides using high pH reversed-phase peptide fractionation, the protein level was assessed using nano-LC-MS/MS using a hybrid Quadrupole-Orbitrap™ mass spectrometer. Moreover, we applied in-gel digestion as additional fractionation approach to increase the number of quantified proteins for deep proteomics approach. The obtained MS/MS spectra were analyzed using MaxQuant software. In total, 3,537 proteins were identified, of which 3,492 (98.7%) were quantifiable with a protein-level FDR < 0.01 (Fig. 1D). The 3,537 proteins are listed in Supplementary Table S1.
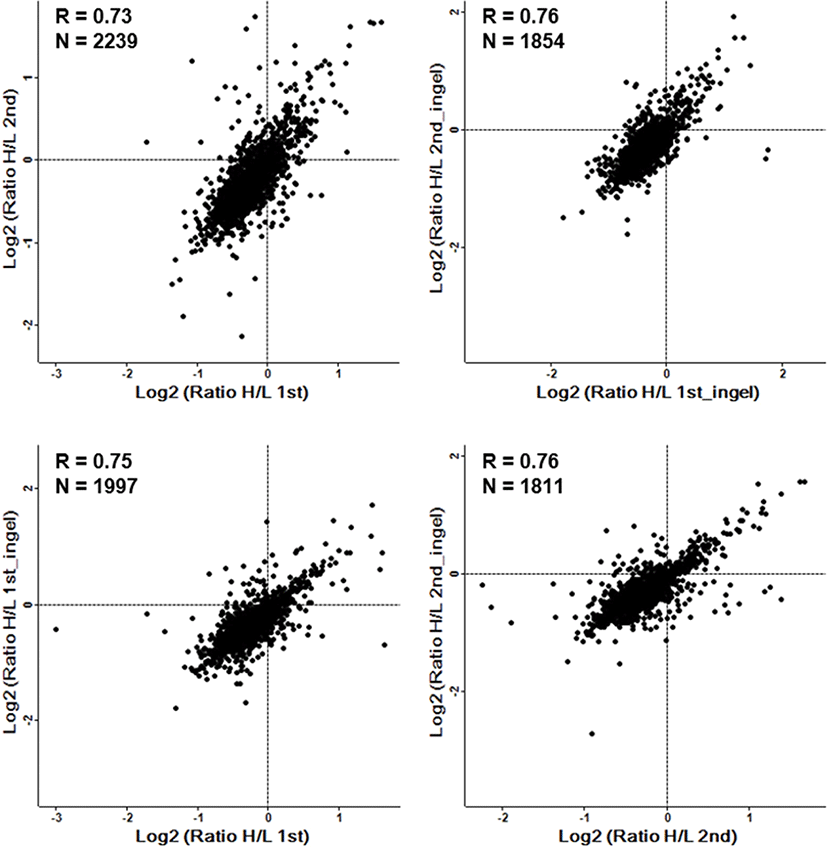
Among the 3,492 quantified proteins, 29 proteins were upregulated (normalized Heavy / Light (H/L) ratio > 2.0) and 38 proteins were downregulated (normalized H/L ratio < 0.5) in the Runx3 KO mESCs (Fig. 1D). The DEPs are summarized in Tables 1 and 2 for upregulated and downregulated proteins, respectively. The most upregulated proteins were ATP-dependent (S)-NAD(P)H-hydrate dehydratase (H/L ratio 8.4) and peroxisomal acyl-coenzyme A oxidase 1 (H/L ratio 7.9). By contrast, serum albumin (H/L ratio 0.038) and titin (H/L ratio 0.067) were identified as the most downregulated proteins. Additionally, we used technical replicates to improve the accuracy of the results. To evaluate the reproducibility of the data, the correlation factor between the duplicated analyzed results obtained by in in-gel and in sol-digestion, respectively, was calculated, which showed a significant correlation, with an R value of 0.7 or higher (Fig. 2).

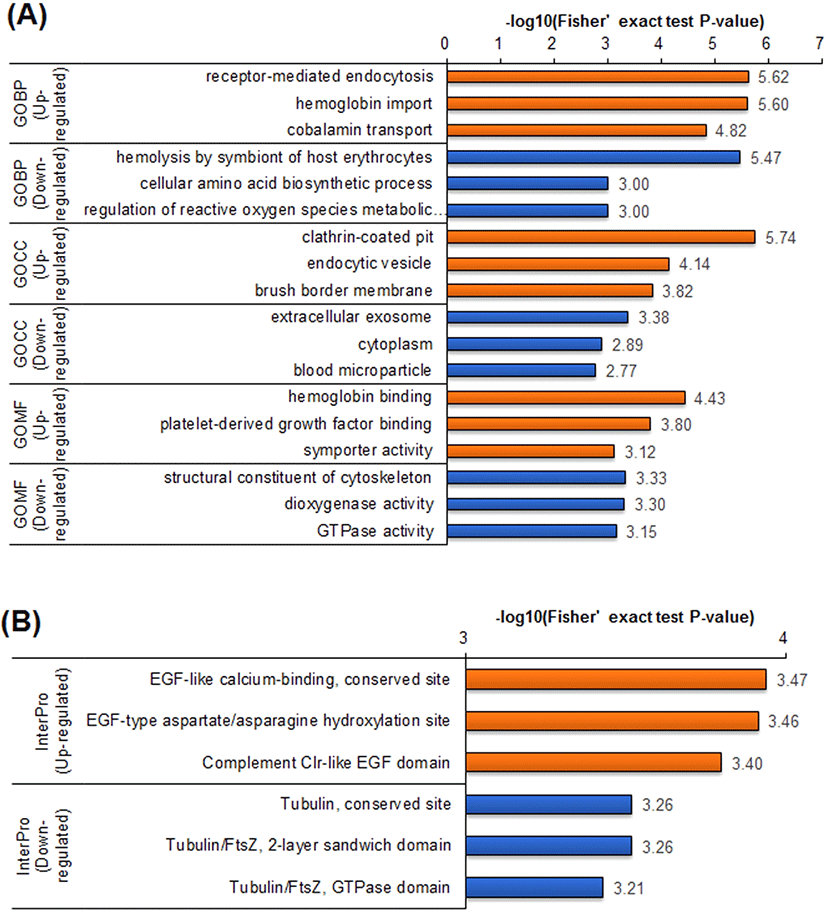
To further understand the protein dynamics resulting from loss of Runx3 in mESCs, we performed GO term enrichment analyses for the DEPs using the DAVID software (Fig. 3A). Generally, the enrichment of GO terms in the upregulated DEPs was distinct from enrichment in the downregulated DEPs. In the GO biological pathway (GOBP) category, the upregulated DEPs in Runx3 KO mESCs were associated with receptor-mediated endocytosis, hemoglobin import, and cobalamin transport, represented by proteins such as cubilin and amnionless. By contrast, the downregulated DEPs were enriched in diverse biological pathways, such as hemolysis, amino acid biosynthetic process, and reactive oxygen regulation.

The GO cellular component (GOCC) category was also clearly distinguished between the upregulated and downregulated DEPs in the Runx3 KO mESCs. In GOCC, the upregulated DEPs were linked to substances transfer into cells, such as clathrin-coated pits, endocytic vesicles, and membranes. Whereas the downregulated DEPs in the GOCC category were associated with diverse cell components. Even in the GO molecular function (GOMF) category, the upregulated DEPs were enriched in material transport, such as symporter activity. The downregulated DEPs in the GOMF category notably were associated with the cytoskeleton, which was corroborated by the InterPro enrichment analysis, which indicated the predicted domains and important sites (Fig. 3B). Downregulated DEPs were associated with Tubulin functions in the InterPro category, and the domain enrichment analysis also showed that enriched tubulin function. The upregulated DEPs were enriched in epidermal growth factor (EGF) functions in both the InterPro and domain enrichment analyses.
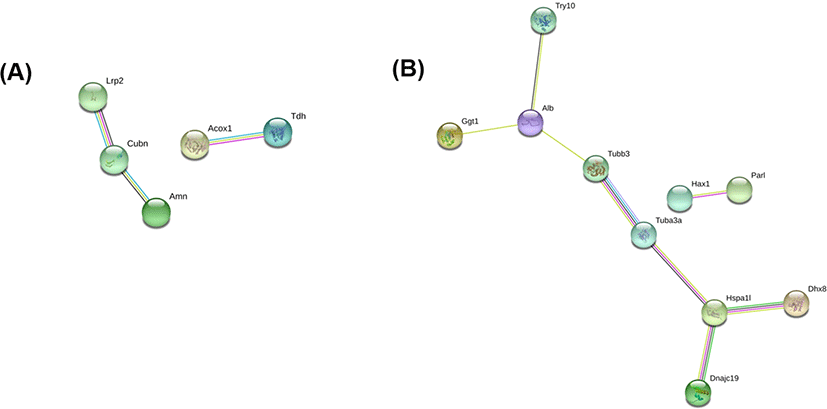
Fig. 4 shows the results of the protein-protein interaction analysis using STRING, a search tool for recurring instances of neighboring genes among up- and downregulated DEPs, which reconstructed a network model for the DEPs [14]. In the STRING analysis of the upregulated DEPs, low-density lipoprotein receptor-related protein 2 (Lrp2), cubilin (Cubn), and protein amnionless (Amn) were annotated in the same cluster, which are associated with receptor-mediated endocytosis, hemoglobin import, and cobalamin transport in the GOBP category. Another cluster included peroxisomal acyl-coenzyme A oxidase 1 (Acox1) and L-threonine 3-dehydrogenase (Tdh). For the downregulated DEPs, two tubulins (Tubb3 and Tuba3a) were in the main cluster in the STRING analysis (Fig. 4B). These are tubulins are linked to serum albumin (Alb), the most downregulated DEP, and to Heat shock 70 kDa protein 1-like (Hspa1l), mitochondrial import inner membrane translocase subunit TIM14 (Dnajc19), and ATP-dependent RNA helicase DHX8 (Dhx8).

In previous studies, it was reported that Runx3 KO is related to the development of myeloproliferative disorders, like leukemogenesis, myeloid-dominant leukocytosis, and splenomegaly [7, 15, 16]. Chronic myeloproliferative disorders are a group of slow-growing blood cancers in which the bone marrow makes too many abnormal red blood cells, white blood cells, or platelets, which then accumulate in the blood. Our data suggested a mechanism by which myeloproliferative disorders occur in conditions of RUNX3 deficiency. In Runx3 KO mESCs, levels of proteins involved in hemoglobin import and cobalamin transport were upregulated, whereas the levels of proteins related to hemolysis of symbionts of host erythrocytes were decreased (Fig. 3). Taken together, these findings enhance our current understanding of the link between lack of the RUNX3 protein and myeloproliferative disorders.
In addition, the levels of tubulin alpha-3 and beta-3 chains were strongly decreased in Runx3 KO mESCs, in which the decrease in tubulin levels were annotated in the enrichment analysis of GOMF, InterPro, and domain. In a study to find binding partners of RUNX3 using a mass spectrometry-based approach coupled with SILAC technology, RUNX3 was shown to bind to gamma-tubulin [17]. In addition, endogenous RUNX2 associates with stabilized microtubules in a concentration-dependent manner and the RUNX2 amino terminus mediates the microtubule association [18]. Moreover, RUNX3 appears to be involved in protein expression related to cell structure. Not only tubulins, but also titin, a filamentous protein spanning the half-sarcomere, was downregulated in Runx3 KO mESCs (Table 2).
In the protein-protein interaction analysis, three proteins, low-density lipoprotein receptor-related protein 2, cubilin, and amnionless were organized in a group. These proteins are commonly associated with receptor-mediated endocytosis, hemoglobin import, and cobalamin transport in the GOBP category (Fig. 3A). In particular, mammalian cubilin and amnionless are two major receptors for protein reabsorption in the proximal tubule [19]. Cubilin was first identified as the intrinsic factor–vitamin B12 receptor in mammals, and binds to albumin for renal proximal tubule protein reabsorption [20, 21]. In addition, cubilin is also involved in the renal clearance of hemoglobin [22]. Cubilin is also associated with hemoglobin binding in the GOMF category (Fig. 3A). Moreover, amnionless forms a functional receptor complex with cubilin, which is required for the endocytic function of cubilin in renal proximal tubules [23]. Based on these observations and the results of the present study, cubilin and amnionless could be an important protein regulated by RUNX3.
In the present study, we investigated the protein profile in response to Runx3 KO in mESCs using a SILAC-based quantitative proteomic strategy. We identified 3,538 proteins, and of which 3,494 proteins could be quantified. Based on GO, Interpro, and STRING analysis, significant biological processes involving RUNX3 were suggested, especially those related to substances transport and cellular structure. Taken together, the results enhance our current understanding of the function of RUNX3 in mESCs and suggest potential roles for RUNX proteins in diverse diseases.
