Journal of Biomedical Translational Research
Research Institute of Veterinary Medicine, Chungbuk National University
Original Article

Detection of acetaminophen-induced liver damage by fluorescence bioimaging, serum biochemistry and histopathological examination

Jin Seok Kang1,2,*https://orcid.org/0000-0002-4492-3101
1Department of Biomedical Laboratory Science, Namseoul University, Cheonan 31020, Korea
2Molecular Diagnostics Research Institute, Namseoul University, Cheonan 31020, Korea
*Corresponding author: Jin Seok Kang, Department of Biomedical Laboratory Science, Namseoul University, Cheonan 31020, Korea Tel: +82-41-580-2721, Fax: +82-41-580-2932, E-mail: kang@nsu.ac.kr

© Research Institute of Veterinary Medicine, Chungbuk National University. All rights reserved.

Received: Jan 10, 2020; Accepted: Feb 17, 2020

Published Online: Mar 31, 2020

Abstract

The purpose of this study was to examine the characteristics of acetaminophen (APAP)-induced liver damage, using fluorescence bioimaging, serum biochemistry, and histopathology. At six weeks of age, eighteen mice were divided into three groups as group 1 (G1) as control, group 2 (G2) as fluorescence probe control and group 3 (G3) as APAP-treated. G3 mice were orally treated with APAP (800 mg/kg b.w.), while G1 and G2 mice were treated with 0.9% saline. Twenty-two hours after APAP treatment, G2 and G3 mice were intravenously treated with Annexin-Vivo 750 as probe, while G1 mice were treated with saline. Fluorescence bioimaging was performed at two hours after probe treatment. The mice were sacrificed and serum levels of aspartate aminotransferase, alanine aminotransferase, alkaline phosphatase and lactate dehydrogenase were analyzed. Liver damage was examined by hematoxylin and eosin (H&E) staining and terminal deoxynucleotidyl transferase dUTP nick end labeling (TUNEL) staining. In vivo bioimaging, fluorescence intensity of the region of interest (ROI) was significantly increased in the livers of G2 and G3 mice compared with those in G1 mice (p<0.05 and p<0.01). In addition, ex vivo bioimaging confirmed that the fluorescence intensity of the ROI was significantly increased in the livers of G2 and G3 mice compared with those in G1 mice (p<0.05 and p<0.01). All examined serum parameters of G3 were significantly increased compared with G1 and G2 (p<0.05 and p<0.01). H&E examination showed acute hepatic cell necrosis in the livers of G3 mice, while there was no cell death in the livers of G1 and G2 mice. TUNEL staining also showed many cell death features in G3 mice, whereas no pathological findings were shown in G1 or G2 mice. In summary, fluorescence bioimaging showed the possibility of cell death detection in the livers of mice treated with APAP, and this was corroborated by serum chemistry and histopathological examination.

Keywords: mice; acetaminophen; cell death; fluorescence bioimaging; histopathology

Introduction

A challenging aspect of pharmacological and/or toxicological research has been the identification of cellular processes in live animals. Among these processes, cell death could serve as an indicator for chemical-induced change(s) [1]. Practically, cell death cannot be observed by the naked eye in live animals, nor by stereomicroscope during necropsy. As estimating cell death is a critical step in the evaluation of disease progression [2], many tools and techniques have been developed to study it [38]. Among them, histopathological techniques, such as general staining or specific immunohistochemical staining, have a strong advantage for the detection of cell death that occurs in a cell specific manner [9]. However, these conventional techniques take more time to identify cellular damage than new approaches, such as bioimaging.

Developments in bioimaging technologies and techniques have led to their widespread use in toxicity studies of hazard chemicals and pharmaceuticals in development. Bioimaging is also increasingly used to visualize biological processes underlying disease activity [10]. For example, bioimaging has successfully monitored the progression and regression of pathological lesions [11]. Optical bioimaging using fluorescence probes has proved especially effective for visualizing biological processes [12].

Acetaminophen (APAP) is a common over-the-counter medication used for its analgesic and antipyretic properties [13]. APAP is mainly metabolized in the liver, and its use is often avoided in patients with chronic liver disease, owing to the risk of APAP-induced hepatotoxicity [14].

As bioimaging technologies have been used to provide quantitative data about pathological lesions [15], this study aimed to investigate whether fluorescence bioimaging could provide a readout of cell death in mice treated with APAP, and if so, to compare the results with those of conventional clinical and histopathological approaches.

Materials and Methods

Animals and treatment

Five-week-old, male ICR mice were obtained from Nara Biotech Co. Ltd. (Pyeongtaek, Korea) and acclimated for one week before the start of the study. The animals were placed in a temperature-controlled room (22 ± 3°C) with 55 ± 5% relative humidity and a 12-h light/dark cycle. They were fed with chlorophyll-containing ingredients, particularly, an alfalfa-free diet (Harlan Laboratories, Inc., Madison, WI) and filtered water. This study (NSU-15-6) was approved by the animal experiment committee of Namseoul University based on the Animal Protection Act.

At six weeks of age, eighteen mice were randomly divided into three groups. Group 1 (G1) and group 2 (G2) mice were treated with 0.9% saline in equal volumes at six weeks of age. Group 3 (G3) mice were orally treated with APAP (800 mg/kg b.w.) at equivalent times. Twenty two hours after APAP treatment, G2 and G3 mice were intravenously treated with the Annexin-Vivo 750 probe (PerkinElmer, Waltham, MA; 100 μL/mouse), according to the manufacturer’s instructions. Annexin-Vivo 750 is a targeted fluorescence imaging agent developed to detect molecular aspects of cell death [3]. At the same time, G1 mice were treated with equal volumes of 0.9% saline solution.

Fluorescence bioimaging

At twenty four hours after APAP treatment, the mice were anesthetized with 2.2.2-tribromoethanol (Sigma-Aldrich, St. Louis, MO). The mice were then placed horizontally in the imaging chamber of a fluorescence-labeled organism bioimaging instrument (FOBI) system (Neoscience, Suwon, Korea). Fluorescence bioimaging was conducted, and fluorescence position and intensity were recorded. The livers of the mice were excised, fluorescence intensity of the region of interest (ROI) was measured, and the images were analyzed. As fluorescence intensity decreases over time, measurement of signal intensity in the fluorescence probe control group was carried out within four hours after animal sacrifice.

Serum chemistry

After fluorescence bioimaging, blood was taken from the abdominal aortas of the mice, and serum levels of aspartate aminotransferase (AST), alanine aminotransferase (ALT), alkaline phosphatase (ALP) and lactate dehydrogenase (LDH) were analyzed.

Histopathological examination

After fixation in 10% neutral phosphate-buffered formalin, liver tissues were processed and embedded in paraffin, and 4 μm sections were stained with hematoxylin and eosin (H&E) for histopathological examination.

Terminal deoxynucleotide transferase dUTP nick end labeling (TUNEL) staining

Tissue sections were dewaxed with xylene and hydrated. They were treated with proteinase K and 3% hydrogen peroxide, and with TdT enzyme and anti-digoxigenin peroxidase conjugate in In Situ Apoptosis Detection Kit (Chemicon International, Temecula, CA). Avidin-biotin complexes were visualized by DAB (Sigma).

Statistical analysis

GraphPad Prism 6 (GraphPad Software, La Jolla, CA) was used for statistical analyses by Dunnett’s multiple comparison test following one-way analysis of variance and Student’s t-test. For all comparisons, probability values <5% were considered to be statistically significant.

Results

Fluorescence bioimaging

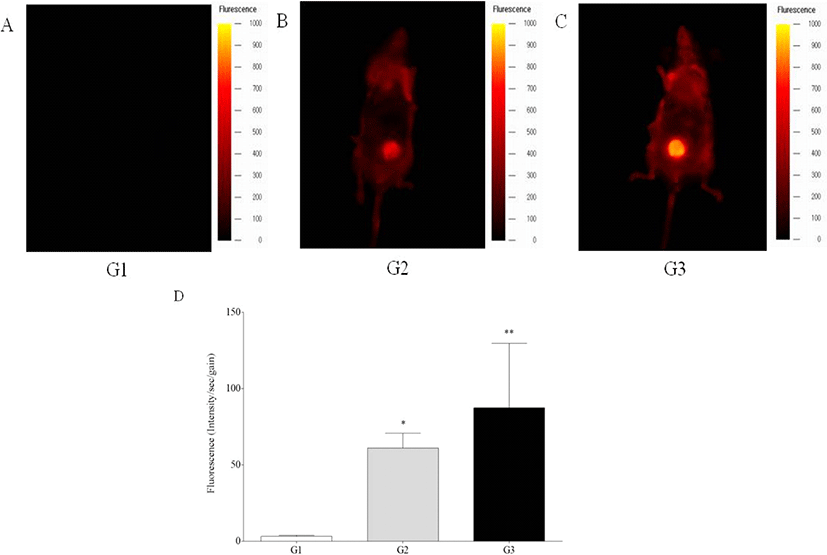
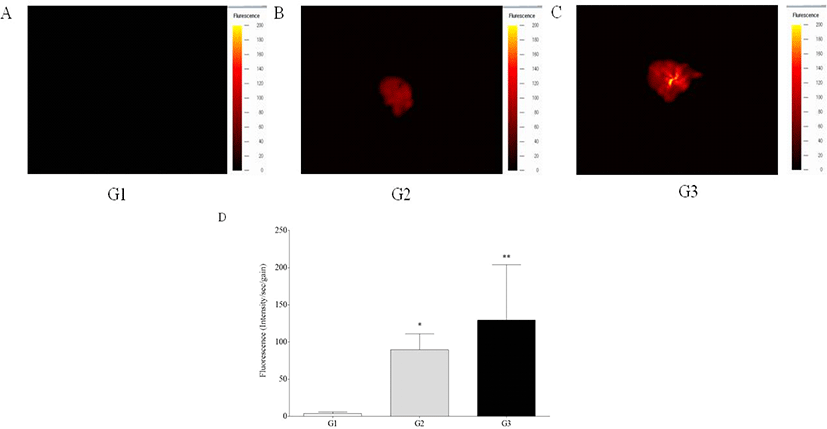
In vivo fluorescence intensity was detected in the livers of G2 and G3 mice, while those of G1 mice showed no signal, showing significant increase of fluorescence intensity of G2 and G3 mice compared to G1 mice (p<0.05 and p<0.01) (Fig. 1). Ex vivo fluorescence intensity of the livers from G2 and G3 mice was significantly increased compared with those of G1 mice (p<0.05 and p<0.01) (Fig. 2). However, in vivo and ex vivo data, there were no statistical difference of intensity between G2 and G3.
jbtr-21-1-11-g1
Fig. 1. Fluorescence imaging of mice detected by FOBI imaging system using Annexin-Vivo 750. (A) FOBI imaging of G1 as control. (B) FOBI imaging of G2 as probe-treated. (C) FOBI imaging of G3 as probe and acetaminophen-treated. (D) Quantification of tomographic liver. *, **Significantly different from G1 (p<0.05 and p<0.01). Values represents shown as mean ± S.D. FOBI, fluorescence-labeled organism bioimaging instrument.
Download Original Figure
jbtr-21-1-11-g2
Fig. 2. Fluorescence imaging of liver detected by FOBI imaging system using Annexin-Vivo 750. (A) FOBI imaging of G1 as control. (B) FOBI imaging of G2 as probe-treated. (C) FOBI imaging of G3 as probe and acetaminophen-treated. (D) Quantification of tomographic liver. *, **Significantly different from G1 (p<0.05 and p<0.01). Values represents shown as mean ± S.D. FOBI, fluorescence-labeled organism bioimaging instrument.
Download Original Figure
Serum chemistry

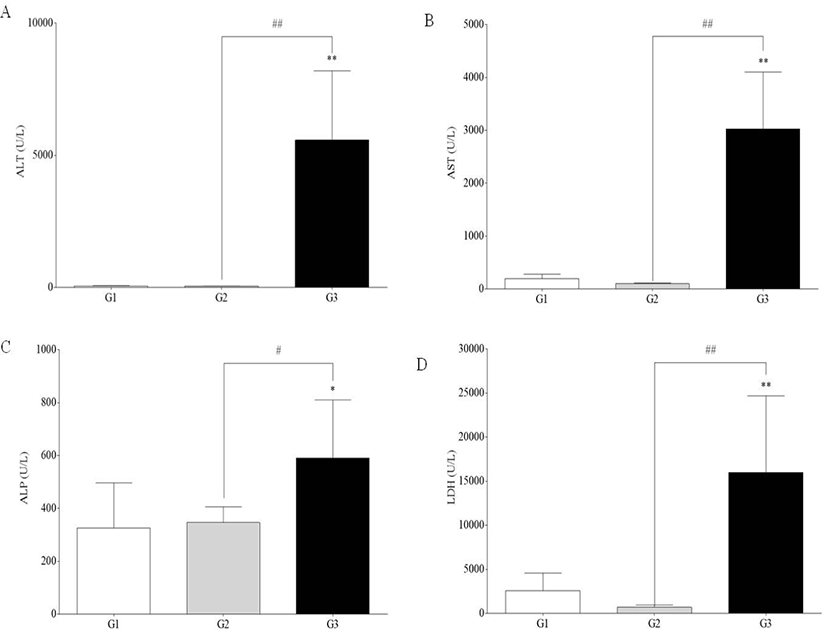
Serum levels of AST, ALT, ALP, and LDH were significantly increased in G3 compared to G1 and G2 (p<0.05 and p<0.01). However, there was no difference between G1 and G2 (Fig. 3).
jbtr-21-1-11-g3
Fig. 3. Serum chemistry values of ALT (A), AST (B), ALP (C), and LDH (D). *,**Significantly different from G1 (p<0.05 and p<0.01); #,##Significantly different from G2 (p<0.05 and p<0.01). Values were presented as the mean ± S.D. AST, aminotransferase; ALT, alanine aminotransferase; ALP, alkaline phosphatase; LDH, lactate dehydrogenase.
Download Original Figure
Histopathological examination

G1 and G2 mice showed no cell death in the liver. However, G3 mice showed acute hepatic cell necrosis, mainly located around the central veins of the livers (Fig. 4). Diffuse hemorrhage and infiltration of inflammatory cells and disruption of hepatic cell cords were also observed in the livers of G3 mice.

jbtr-21-1-11-g4
Fig. 4. Liver tissues from acetaminophen treated mice were assessed histopathologically by HE staining. (A) G1 as control; (B) G2 as probe-treated; (C) G3 as probe and acetaminophen (APAP)-treated. In G3, numerous cell deaths were observed. However, in G1 and G2, no cell deaths were shown. Hematoxylin & eosin staining, magnification, × 200.
Download Original Figure
TUNEL staining

TUNEL staining showed many cell death features for G3, and none for G1 and G2 mice (Fig. 5). Numerous cell deaths were observed in the livers of G3 mice treated with APAP, mainly located around the central veins of the livers as shown in H&E.

jbtr-21-1-11-g5
Fig. 5. Liver tissues from acetaminophen treated mice were assessed histologically by immunohistochemistry of apoptosis. (A) G1 as control; (B) G2 as probe-treated; (C) G3 as probe and acetaminophen (APAP)-treated. In G3, numerous cell deaths labeled as brown color are observed. However, in G1 and G2, no cell deaths were examined. Immunostaining of cell death staining, magnification, × 200.
Download Original Figure

Discussion

Fluorescence bioimaging was used to visualize the target molecule for cell death. To investigate disease progression, it is important to detect and monitor pathological lesions in vivo. In this study, in vivo fluorescence bioimaging was used to visualize the target molecules for cell death, and the results generally agreed with clinical and pathological assessment. Specifically, in vivo fluorescence bioimaging showed that a significant increase in fluorescence intensity in G3 mice compared to G1 mice, representing effective quantification of cell death in the ROI. However, because of the depth limitation of fluorescence bioimaging [16], it was difficult to detect fluorescence signal in intact mice. Furthermore, fluorescence bioimaging did not provide clear discrimination of the liver from surrounding organs. Thus, for accurate quantification, it seems that a modality and/or software should be developed to anatomically distinguish the target organ(s) from surrounding organs.

This study’s in vivo imaging of cell death in mice using Annexin-Vivo 750 probe treatment confirms two of the advantages fluorescence bioimaging has over conventional histopathological examination: it allows both for in vivo tracing of altered biological processes, and for in vivo detection of specific molecule(s). However, the study also calls attention to some of in vivo bioimaging’s limitations. So, in this study, after removal of the skin and peritoneum of mice, in vivo bioimaging was obtained. With ex vivo imaging, it seems it is possible to detect the apoptotic area at a closer distance and lower background level. Ex vivo imaging is also limited, however, in that it does not provide sharp margins for damage cells.

Even though several near-infrared fluorescent imaging probes have been used for in vivo bioimaging [12, 17], this paper did not present probe control data, as it is difficult to differentiate probe-induced effect and from drug-induced effects and presents the limitations of fluorescence bioimaging, which will be very helpful for further investigations of bioimaging.

Serum chemistry data showed APAP induced cell damage in G3 mice and HE examination clearly showed G3 mice had severe hepatic damage. In particular, hepatic cells in centrilobular areas were more severely damaged than those in periportal areas in the livers of G3 mice. APAP is metabolized by sulfation and glucuronidation by CYP2E1, producing a reactive metabolite, N-acetyl-p-benzoquinone imine, which is detoxified by conjugation with glutathione [14]. APAP treatment in mice induces an acute phase of hepatitis with alteration of many genes, as shown in a previous report [18].

In this study, fluorescence bioimaging detected cell death in the livers of mice treated with APAP. This outcome was verified by serum chemistry and histopathological examination. However, in contrast to the HE and TUNEL applied in the study, fluorescence bioimaging was not able to clearly identify and differentiate specific pathological lesions in the liver. So, convention serum chemistry and histopathological tools showed cell damage clearly compared to fluorescence bioimaging in this study. The development of new techniques is necessary to over these limitations to current imaging methods [1922]. Specifically, investigations into the detection of pathological lesions using bioimaging with high cellular resolution would be helpful.

Acknowledgements

I would like to thank Ms. Joo Hye Sim for her technical assistance. Funding for this paper was provided by Namseoul University.

References

1.

Corcoran GB, Fix L, Jones DP, Moslen MT, Nicotera P, Oberhammer FA, Buttyan R. Apoptosis: molecular control point in toxicity. Toxicol Appl Pharmacol 1994;128:169-181.

2.

Goldsworthy TL, Fransson-Steen R, Maronpot RR. Importance of and approaches to quantification of hepatocyte apoptosis. Toxicol Pathol 1996;24:24-35.

3.

Schutters K, Reutelingsperger C. Phosphatidylserine targeting for diagnosis and treatment of human diseases. Apoptosis 2010;15:1072-1082.

4.

Ritsma L, Vrisekoop N, van Rheenen J. In vivo imaging and histochemistry are combined in the cryosection labelling and intravital microscopy technique. Nat Commun 2013;4:2366.

5.

Kim S, Bae SM, Seo J, Cha K, Piao M, Kim SJ, Son HN, Park RW, Lee BH, Kim IS. Advantages of the phosphatidylserine-recognizing peptide PSP1 for molecular imaging of tumor apoptosis compared with annexin V. PLoS One 2015;10:e0121171.

6.

Jung HK, Wang K, Jung MK, Kim IS, Lee BH. In vivo near-infrared fluorescence imaging of apoptosis using histone H1-targeting peptide probe after anti-cancer treatment with cisplatin and cetuximab for early decision on tumor response. PLoS One 2014;9:e100341.

7.

Shuhendler AJ, Pu K, Cui L, Uetrecht JP, Rao J. Real-time imaging of oxidative and nitrosative stress in the liver of live animals for drug-toxicity testing. Nat Biotechnol 2014; 32:373-380.

8.

Levin S, Bucci TJ, Cohen SM, Fix AS, Hardisty JF, LeGrand EK, Maronpot RR, Trump BF. The nomenclature of cell death: recommendations of an ad hoc committee of the society of toxicologic pathologists. Toxicol Pathol 1999; 27:484-490.

9.

Eckle VS, Buchmann A, Bursch W, Schulte-Hermann R, Schwarz M. Immunohistochemical detection of activated caspases in apoptotic hepatocytes in rat liver. Toxicol Pathol 2004;32:9-15.

10.

Chen Y, Liang CP, Liu Y, Fischer AH, Parwani AV, Pantanowitz L. Review of advanced imaging techniques. J Pathol Inform 2012;3:22.

11.

de Jong M, Essers J, van Weerden WM. Imaging preclinical tumour models: improving translational power. Nat Rev Cancer 2014;14:481-493.

12.

Weissleder R, Tung CH, Mahmood U, Bogdanov A Jr. In vivo imaging of tumors with protease-activated near-infrared fluorescent probes. Nat Biotechnol 1999;17:375-378.

13.

Benson GD, Koff RS, Tolman KG. The therapeutic use of acetaminophen in patients with liver disease. Am J Ther 2005;12:133-141.

14.

James LP, Mayeux PR, Hinson JA. Acetaminophen-induced hepatotoxicity. Drug Metab Dispos. 2003;31:1499-1506.

15.

Provencher SW. Automatic quantitation of localized in vivo 1H spectra with LCModel. NMR Biomed 2001;14:260-264.

16.

Ellenbroek SI, van Rheenen J. Imaging hallmarks of cancer in living mice. Nat Rev Cancer 2014;14:406-418.

17.

Vasquez KO, Peterson JD. Early detection of acute drug-induced liver injury in mice by noninvasive near-infrared fluorescence imaging. J Pharmacol Exp Ther 2017;361:87-98.

18.

Kang JS, Jeong YK, Shin JH, Suh SK, Kim JH, Lee EM, Kim SH, Park SN. Comparing in vitro and in vivo genomic profiles specific to liver toxicity induced by thioacetamide. J Appl Pharm 2007;15:252-260.

19.

Kim J, Brown W, Maher JR, Levinson H, Wax A. Functional optical coherence tomography: principles and progress. Phys Med Biol 2015;60:211-237.

20.

Jain M, Shukla N, Manzoor M, Nadolny S, Mukherjee S. Modified full-field optical coherence tomography: a novel tool for rapid histology of tissues. J Pathol Inform 2011;2:28.

21.

Hariri LP, Mino-Kenudson M, Mark EJ, Suter MJ. In vivo optical coherence tomography: the role of the pathologist. Arch Pathol Lab Med 2012;136:1492-1501.

22.

Yamanaka M, Teranishi T, Kawagoe H, Nishizawa N. Optical coherence microscopy in 1700 nm spectral band for high-resolution label-free deep-tissue imaging. Sci Rep 2016;6: 31715.