Introduction
With the westernization of lifestyles, increase in the elderly population, and steep increase in the prevalence of hypertension and diabetes mellitus, incidences of ischemic heart disease are steadily increasing. In addition, because of the increased proportion of the elderly population with acute myocardial infarction (AMI), the mortality rate of this disease is also increasing. National statistics for Korea showed that the in-hospital mortality of AMI was approximately 4.5% in 2014, and an additional 5.5% of patients died within 1 year after hospital discharge. Acute coronary syndrome involves an unstable angina, non-ST-segment elevation myocardial infarction (NSTEMI), and ST-segment elevation myocardial infarction (STEMI). All three disease entities have a similar pathomechanism: unstable atherosclerotic plaque rupture and its associated thrombus generation in the coronary artery. Recently, the proportion of NSTEMI in AMI has been continuously increasing and was found to be approximately 50% in acute MI cases, especially in developed countries. Much data support the benefits of a timely fashioned primary revascularization for STEMI. Several types of prognostic factors have already been discussed, including rapid revascularization, Killip classification, and thrombolysis in myocardial infarction (TIMI) before percutaneous coronary intervention (PCI). However, a useful single prognostic factor that can be translated into determining the necessity of urgent revascularization for NSTEMI is still under investigation. Some multifactorial laboratories and clinical decision criteria have been developed to support the efficacy of urgent revascularization, but a useful single prognostic factor is still ambiguous for NSTEMI [1-5]. N-terminal pro-brain natriuretic peptide (NT-proBNP) is secreted by an abnormal mechanical stretch in a ventricle, which increases the blood level of NT-proBNP for heart failure (HF). The blood level of NT-proBNP correlates well with the severity of systolic dysfunction of the left ventricle. A high level of NT-proBNP during treatment indicates a bad long-term prognosis for HF. NT-proBNP is a very useful biomarker for an initial diagnosis of HF. It predicts a short or longterm prognosis and determines the initial response and efficiency of treatment in HF patients [6, 7]. The value of NT-proBNP may act as an important diagnostic factor in a prospective multicenter cohort of patients hospitalized with a diagnosis of acute HF [8]. NT-proBNP has affected patients with adult congenital heart disease and plays an important role in patient management and monitoring [9]. It is also associated with cardiac arrest in infants and children younger than 3 years with heart failure due to congenital heart disease and myocardial infarction [10].
Therefore, concerns about treatment for NSTEMI patients have been increasing. In particular, an early invasive strategy with PCI for high-risk patients is known to be better than a conservative therapy method. According to the guidelines of the American College of Cardiology/ American Heart Association (ACC/AHA), an early invasive strategy has been presented for high-risk NSTEMI patients. This early invasive strategy suggests performing PCI within 48 h after the onset of chest pain in NSTEMI patients. Recently, prompt treatment within 12 or 24 h has been reported to be effective at protecting the myocardium and producing a better prognosis for NSTEMI. The clinical significance of NT-proBNP in NSTEMI when treated with an early invasive strategy is still ambiguous. Therefore, we tried to find the diagnostic significance of NT-proBNP in NSTEMI patients who have undergone an early invasive strategy by using the Korean Working Group Myocardial Infarction (KorMI) database [11-19].
Some NSTEMI patients face as much danger as STEMI patients. In this study, we tried to use the value of NTproBNP as a way to identify a small number of such patients in advance and test the role of NT-proBNP as an evaluation index that can affect the diagnosis of patients. We divided the NT-proBNP measurements into two groups and matched the variables that required adjustment by using propensity scores (PSs). We matched the variables by using propensity score matching (PSM) and propensity score weighting (PSW) and conducted a survival analysis for major adverse cardiac events (MACEs) and death according to the NT-proBNP level.
Population and Methods
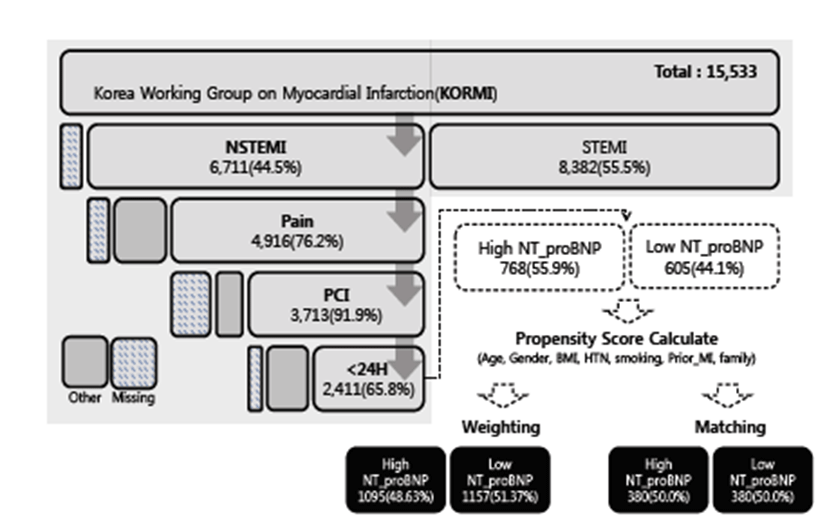
KorMI registration was initiated to find the clinical characteristics, treatment methods, and in-hospital and long-term prognoses of Korean AMI patients from 2005. This was conducted as a memorial project for the 50thyear anniversary of the Korean Society of Cardiology [20]. The KorMI registry is the second wave of registration for the KAMIR project, which operated from 2008 to 2013. The project has registered 15,533 AMI patients, including 8,382 STEMI patients and 6,711 NSTEMI patients. NSTEMI patients who underwent PCI mainly with a drug-eluting stent within 24 h after the onset of chest pain were selected from the KorMI registry and analyzed. Figure 1 shows the entire sampling procedure for the study population. First, the data were classified into 8,382 (55.5%) STEMI, 6,711 (44.5%) NSTEMI, and 440 missing values. Next, the data were classified into 4,916 (76.2%) with pain, 1,539 (23.8%) with no pain, and 256 missing values. Next, we classified the data into whether the patients received PCI within 24 h. The results showed that 2,411 (65.8%) of PCI treatments were within 24 h, 1,252 (34.2%) were after 24 h, and 50 missing values. We extracted data by using two methods with PSs for the data that needed revision.
Continuous variables were expressed as the mean ± standard deviation, and categorical variables were expressed as a number and percentage. SAS ver 9.3 was used for the statistical analysis [21]. Observation studies tend to have a selection bias by their nature. In order to minimize such selection bias, confounding variables should be controlled using a matching or statistical adjustment method. When NT-proBNP, which was the marker of the study subjects, is divided into two groups, there can be a bias that leans toward one side. To resolve such an imbalance, this study used PSs. Because various variables influence the calculation of a PS, independent variables should be adjusted to test the effect of the NT-proBNP marker itself [22]. There are various ways of adjustment; when there are several variables, PS is an effective approach. PSM reduces the number of samples in each group but corrects variables better, while PSW does not correct as well as PSM but includes all of the data in analysis. In this research, we compared and analyzed the data by using PSM and PSW. These methods are based on PS and adjust the variables of the biomarker NT-proBNP. The PS represents the probability adjusted to compare two groups (e.g., therapy group vs. control group) when considering several variables observed for a subject. The PS is defined as the conditional probability for the treatment group given covariates that can be observed for the treatment group and control group. The PS is given by(1)
The PSM method is suitable when there are many control groups in contrast to a small number of treatment groups. The PS is calculated, and subjects are matched with PS values nearest to the treatment and control groups. This method is repeated until all of the treatment groups are matched. We applied the following methods. Transposing the log value of NT-proBNP forms a good normal distribution and produces quantiles such as Q1 4.4, Q2 5.7, and Q3 6.9. We divided the log value of NTproBNP into two groups by using an arbitrary value of 6, which was very close to the median value of 5.7. Thus, we classified subjects with log (NT-proBNP) greater than 6 as the high group and subjects with log (NT-proBNP) less than 6 as the low group. To control independent variables, we matched the PSs. To verify the value of the biomarker NT-proBNP, the variables used for the PS were the age, gender, BMI, hypertension, hyperlipidemia, smoking, prior MI, and family history of cardiovascular disease.
Next, the PSW method was used. This is an estimation technique that gives weights by using the inverse of the PS value. This method is called inverse probability weighting (IPW) and can compare more than two groups. The weight of each group was defined as follows in Equations (2) and (3). To apply PSW, we classified the group with high NT-proBNP values as the treatment group and the group with low values as the control group. Then, we weighted each group [23].
From the KorMI data, four types of MACEs were identified: death, MI, ST, and TVR. We performed Kaplan– Meier analysis on the individual MACE types and all four events. However, the number of ST, TVR, and MI events was too small to affect the survival analysis. Next, through the Cox regression, we calculated the survival function of the prediction model over time.
Results
For our experiments, we placed the NT-proBNP values into a log and classified them into two groups. Then, we revised the variables to control independent variables by PSM. Figure 2 shows the distribution nature of the log values of NT-proBNP in the two groups using PSM. In other words, it shows the distribution after the log (NTproBNP) values were divided depending on if they were greater than 6 (NT High) and less than 6 (NT Low). We identified half of the samples where the two groups overlapped as matching. First, 1,373 patients were matched; then, the subject patients were reduced to 760.
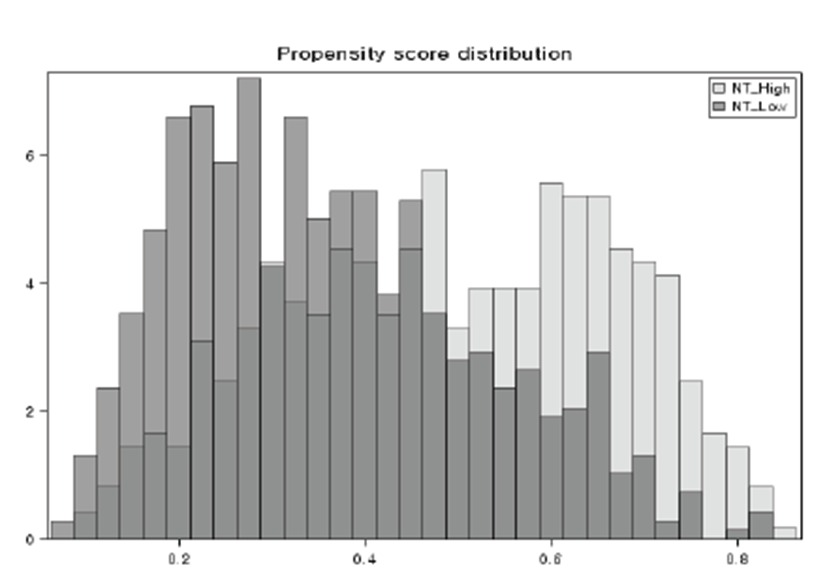
Figure 3 shows the balance checking result for the covariate using PSM. Correction was good from 0.1 to −0.1. This means that, when the value was nearer to 0, the distribution balance between the two groups was better. There was a big imbalance when the value was nearer to 1. Figure 4 shows the balance checking result for the covariate using PSW. There was a poor distribution balance in contrast to PSM, but the advantage was that all of the samples were used. We classified the subject patients into two groups according to the initial NT-proBNP value and compared and analyzed the characteristics before and after PSM. The results showed that all of the revised variables turned out to be significant.
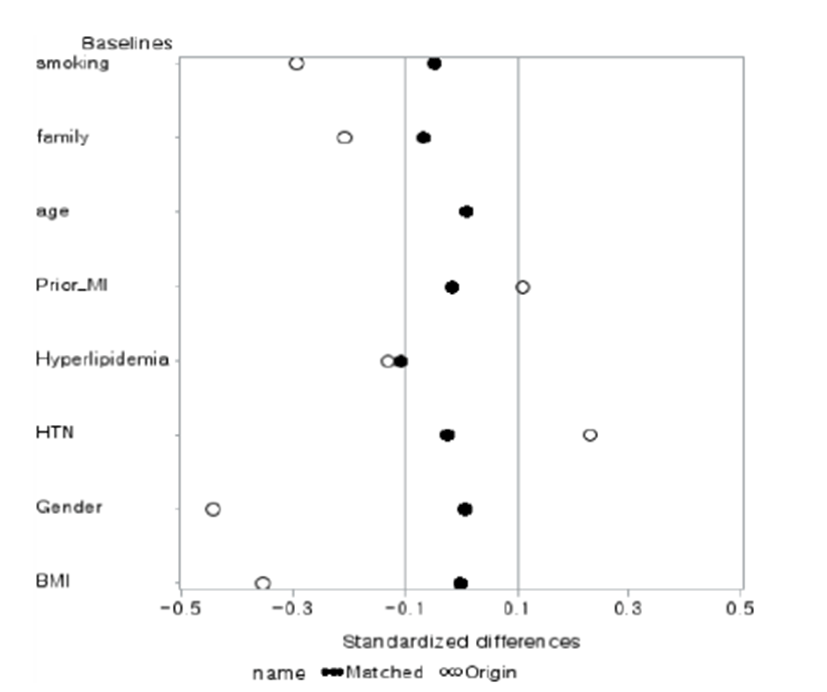
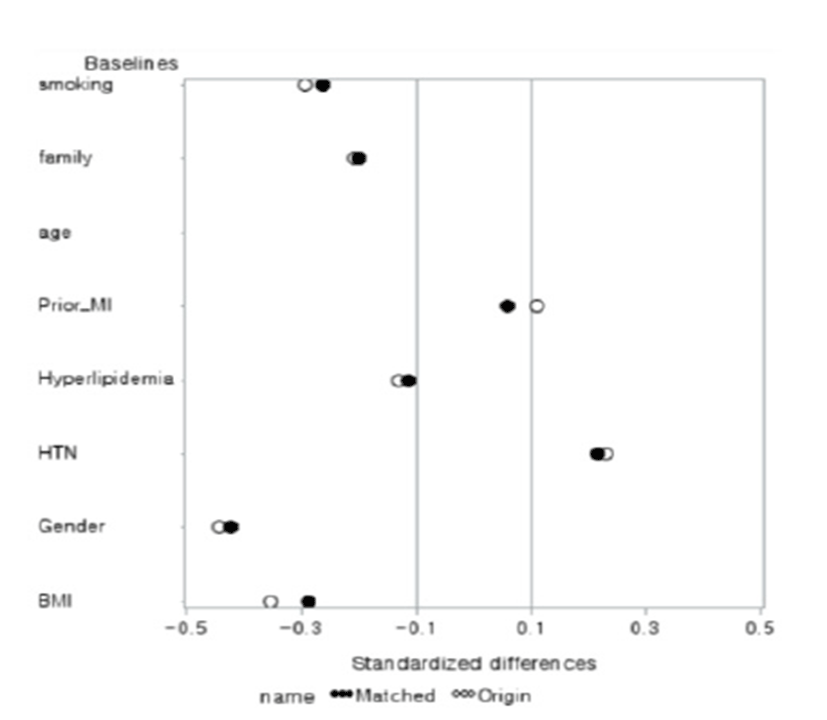
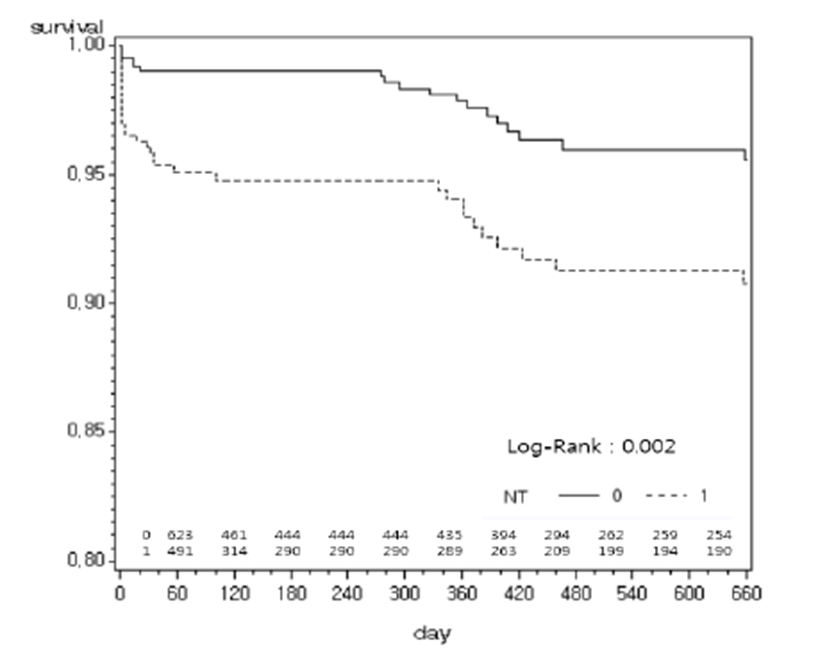
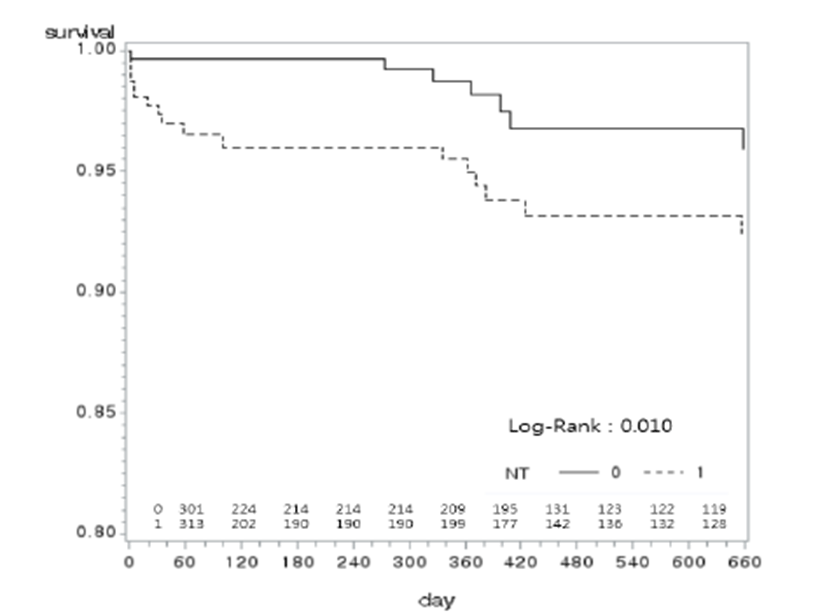
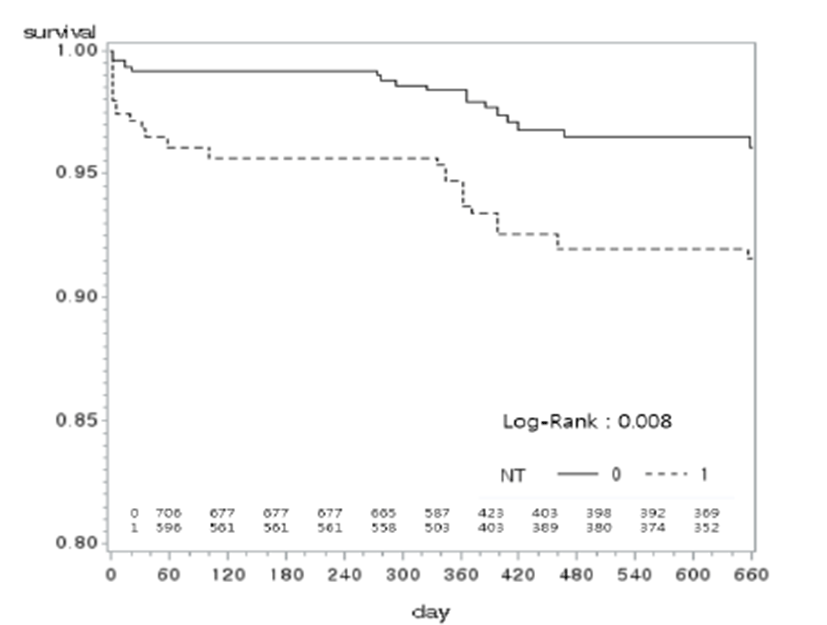
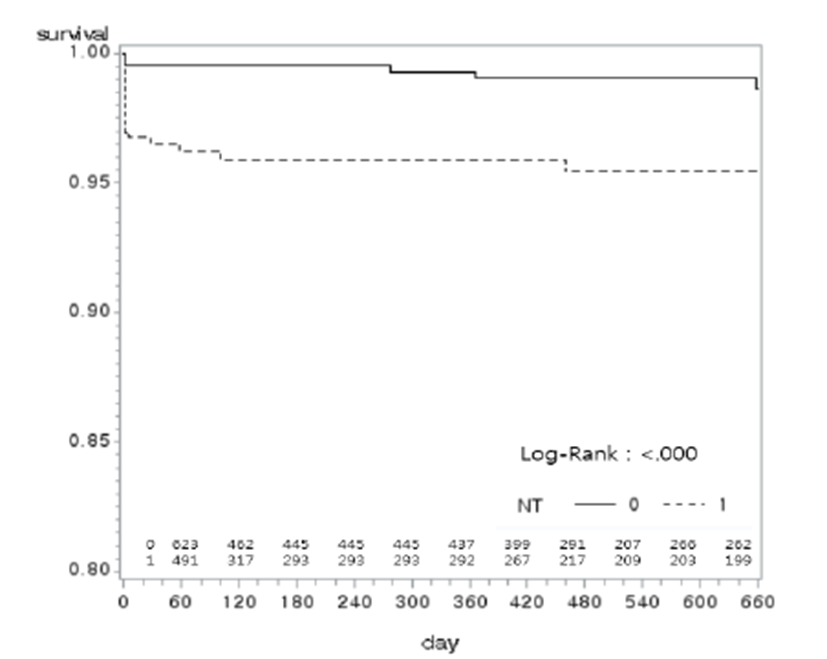
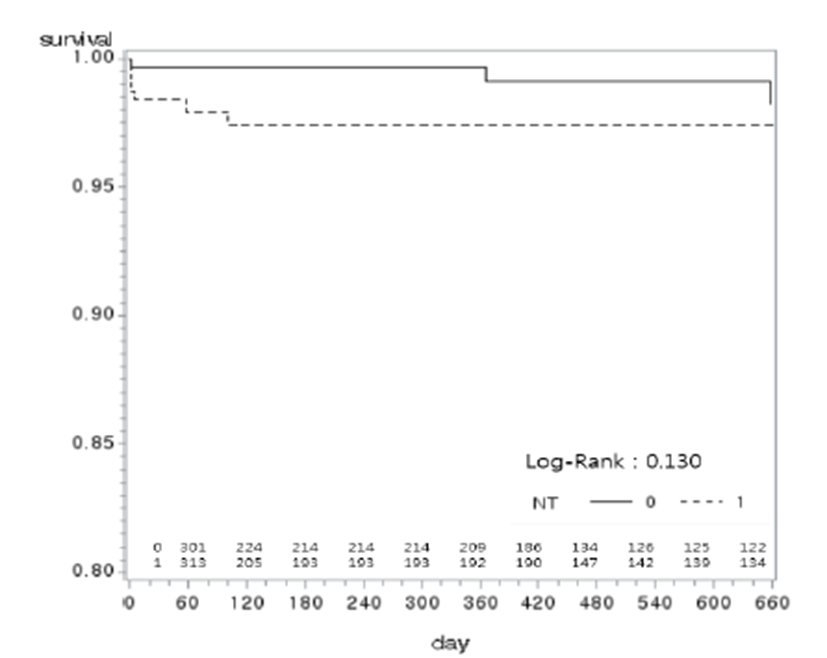
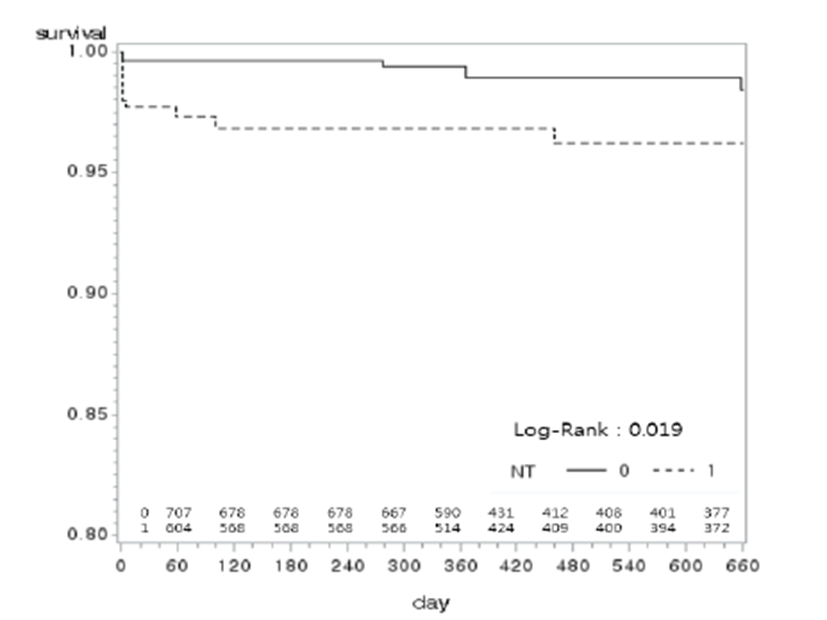
Table 1 presents the corrected results using PSM and PSW methods for all of the variables as baseline characteristics. When PSM was used, the accuracy of the correction increased, but the number of samples decreased. When PSW was used, even though the accuracy of the correction decreased, all of the samples could be used. For survival analysis, we compared all of the MACEs and MACES ending in mortality before and after the revision of PSM with the Kaplan–Meier method. Figures 5 and 6 show all of the MACEs before and after PSM adjustment. Figure 7 shows the results after PSW was applied with the Kaplan–Meier method. For the MACEs, there was a significant difference in the PSW results before and after weighting. There were some differences between the two groups classified according to NT-proBNP values. Figures 8 and 9 show the mortality before and after PSM adjustment. Figure 10 shows the survival analysis results for mortality with PSW. Although there was no significant difference with PSM, as shown in Figure 9, there was a significant difference with PSW. Thus, different results may be obtained according to the sampling method. In the figure, “1” represents values when NT was greater than 6, and “0” represents values when NT was less than 6. The results of the log-rank test are expressed as p-values.
Abbreviations: CCU admission (coronary care unit admission), LV EF (left ventricle ejection fraction), SBP (systolic blood pressure), DBP (diastolic blood pressure), HR (heart rhythm), TC (total cholesterol), TG (triglyceride), LDL-C (low-density lipoprotein-cholesterol), HDL-C (high-density lipoprotein-cholesterol), Cr (creatinine), FBS (glucose), HsCRP (high-sensitivity C-reactive protein), Maximum CK MB (maximum creatinine kinase muscle brain), Target LAD (left anterior descending), Target LCX (left circumflex), Target RCA (right coronary artery), Target LM (left main), DES (drug-eluting stent), DC_ASA (defibrillation cardioversion_acetylsalicylic acid), DC_Clopido (DC_clopidogrel), DC_ DAPT (DC_dual anti-platelet therapy (= aspirin and clopidogrel)), TAPT (asprin, clopidogrel, and cilostazol), DC_BB (DC_beta blocker), DC_ACEI_ARB (DC_ACE inhibitor_angiotensin receptor blocker).
Then we calculated the survival function of a prediction model over time by using the Cox regression model [24, 25]. A hazard function was used to determine the conditional probability of death right after the t point of people who survived to the t point. The hazard function was used in a proportional hazard regression model and was identical to the definition of the instantaneous rate of mortality used in epidemiology. The Cox regression model represents a log risk function at the t point by using a linear expression of many discrimination variables at the t point. That is, in a Cox model with p discrimination variables, the values of the discrimination variable of the i-th characteristic are x′i = (xi1, xi2, …, xip), and the regression model coefficient is β = (β1, β1, · · ·, βp). The Cox regression model is represented as follows:(4)
Here, h0(t) is the baseline hazard function, and we assumed that the many discrimination values have no influence on the risk function.
Table 2 indicates that, when log (NT-proBNP) increases by 1, the risk of MACE increases by 1.312 times through the Cox hazard function. In addition, we identified the confidence interval of (1.014:1.699). These results indicate that NT-ProBNP measurements can be used to assess the predicted prognoses for NSTEMI patients and their effect on MACEs.
| Parameter | Parameter | Chi-square | P>ChiSq | Hazard ratio | 95% CI | |
|---|---|---|---|---|---|---|
|
|
|
|||||
| Estimate | Low | high | ||||
| Log | 0.272 | 4.258 | 0.0391 | 1.312 | 1.014 | 1.699 |
| (NTproBNP) | ||||||
Discussion
NT-proBNP is a well-known biomarker for the diagnosis, treatment efficiency, and prognosis of HF and is directly associated with the severity of systolic and diastolic myocardial dysfunctions. If the pressure of the left ventricle increases, proBNP is released from the cardiac muscle cell of the left ventricle. proBNP is separated into biologically active BNP and non-functional NT-proBNP. Physiological functions of BNP are vasodilatation, diuresis, and natriuresis. In addition, BNP is known to be an important indicator for deciding the function and estimating the prognosis of the left ventricle because the representative neurohormone is secreted from the ventricular muscle by the mechanical overload of the left ventricle in chronic HF.
Some NSTEMI patients face as much danger as STEMI patients. This study tried to use the value of NT-proBNP as a way of identifying a small number of such patients in advance and tested the role of NT-proBNP as an evaluation index that can affect the diagnosis of patients. The subjects of analysis were patients who were diagnosed with NSTEMI, had chest pain, and had PCI surgery within 24 h. In order to divide the value of NT-proBNP into two groups, PS was used to correct the bias between the groups. For analysis, the Kaplan–Meier test was used. Each MACE (all cases, ST, TVR, MI, death) was compared and analyzed using PSM and PSW to observe any differences before and after PS application. For ST, TVR, and MI, few events occurred, so survival analysis was difficult. Only the MACES of all cases and death showed significant differences in the analysis results. With the Cox regression, the analysis showed that increasing the log value of NT-proBNP by 1 raised the risk of a MACE 1.312 times. The Kaplan–Meier and Cox regression results showed that NT-proBNP can be used as an evaluation index for NSTEMI patients.
This study was limited in that the reliability of the data needs to be secured through data collection and integrated management for prospective follow-up research on prognosis of patients with AMI as well as management indices. Biochemical indices for prognosis prediction would help a clinician determine an appropriate course of treatment. Future research is needed to examine changes in the blood NT-proBNP over time among patients with acute coronary syndrome. In addition, studies on treatment plans depending on blood NT-proBNP levels need to be conducted in order to determine treatment strategies for patients with acute coronary syndrome.
