ARTICLE
Changes in potassium concentration and gene expression in mice fed a high-fat diet
Junkoo Yi2,#, Rijin Kang1,#, Zaeyoung Ryoo3, Duhak Yoon1,*, Sunghyun Kim4,*, Myoungok Kim1,*
1School of Animal BT Sciences, Kyungpook National University, Sangju 37224, Korea
2Livestock Research Institute, Yeongju 36052, Korea
3School of Life Science and Biotechnology, Kyungpook National University, Daegu 41566, Korea
4Center for Laboratory Animal Resources, Kyungpook National University, Daegu 41566 Korea
These authors contributed equally to this study.
*Corresponding author : Myoungok Kim School of Animal BT Sciences, Kyungpook National University, Sangju 37224, Korea Tel: +82-54-530-1234, Fax: +82-54-530-1229,
ok4325@knu.ac.kr Sung Hyun Kim Center for Laboratory Animal Resources, Kyungpook National University, Daegu, 41566 Korea Tel: +82-53-420-4839, Fax: +82-53-253-4819,
shkim92@knu.ac.kr Duhak Yoon School of Animal BT Sciences, Kyungpook National University, Sangju 37224, Korea Tel: +82-54-530-1227, Fax: +82-54-530-1229,
dhyoon@knu.ac.kr
© Research Institute of Veterinary Medicine, Chungbuk National University All rights reserved. This is an Open-Access article distributed under the terms of the Creative Commons Attribution Non-Commercial License (http://creativecommons.org/licenses/by-nc/3.0/) which permits unrestricted non-commercial use, distribution, and reproduction in any medium, provided the original work is properly cited.
Received: Nov 13, 2015; Revised: Dec 11, 2015; Accepted: Dec 13, 2015
Abstract
Obesity is a risk factor for various diseases, including cardiovascular disease, diabetes, renal disease, hypertension, cancer, and neural disease. Adipose tissue in animals is important for the mobilization of lipids, milk production, deposition of fat in different depots, and muscle and meat production. Understanding the genetic and physiological causes of metabolic disease is a priority in biomedical genome research. In this study, we examined several variables in mice fed a high-fat diet, including serum composition, body weight, total calorie intake, and differentially expressed genes. Body weight and blood glucose levels were not significantly different between animals fed high-fat and normal diets. However, high-fat diet groups showed reduced calorie and food intakes. Levels of sodium, ionized calcium, glucose, hematocrit, hemoglobin, pH, PCO2, PO2, TCO2+, HCO3+, base excess, and SO2 in the blood were not significantly different between mice fed high-fat and normal diets. Serum potassium concentration, however, was lower in mice a high-fat diet. Differentially expressed genes were also compared between the two groups. The purpose of this study was to discover new genes as a result of annealing control primer (ACP) PCR using 20 random primers. Five down regulated genes were identified and three of others were up-regulated by high-fat diet. Known genes were excluded from this result. In addition, the relationships among candidate genes and high-fat diet should be investigated according to potassium concentration in the blood. In conclusion, mice fed normal and high-fat diets showed no significant difference in body weight, whereas high-fat diet led to changes in blood composition and differential expression of several genes. These findings may provide a better understanding of the mechanisms underlying the association between obesity and metabolic diseases.
Keywords: high fat; obesity; blood composition; annealing control primer-polymerase chain reaction; potassium level
Introduction
According to population-based studies, diabetes is caused by an imbalance in energy status, such as excess energy from overeating or an energy deficit. Adipose tissue is important for energy storage. Studies on animal adipose tissue have focused mainly on the mobilization of lipids, milk production, deposition of fat in different depots, and muscle and meat production [1]. In humans, obesity is an established risk factor for various diseases, including cardiovascular disease, diabetes, renal disease, hypertension, cancer, and neural disease [2-4].
Mice fed a high-fat diet reportedly show significant differences in potassium concentration [5]. The thin obesity phenotype is commonly observed in modern people's peculiar high-fat diet. In addition, altered potassium concentration contributes to the occurrence of Korean adult diseases such as hypertension, diabetes, and vascular disease.
Potassium is a primary electrolyte and is concentrated within cells. Only 2% of the body's total potassium is available in the serum or bloodstream, and small changes in serum potassium levels can affect body function. One of the more important functions of potassium is maintenance of electrical activity in cells. As the major intracellular cation in the body, potassium is required for normal cellular function and metabolic balance. Cells with high electrical activity are particularly affected when potassium levels decrease [6]. Low serum potassium levels and low dietary potassium intake are associated with many metabolic disorders [7]. A low serum potassium concentration is related to disorders of glucose-lipid metabolism, and low potassium values are associated with higher glucose values in people under thiazide diuretics therapy [8]. Previous studies have shown that potassium depletion can cause insulin resistance, and therapeutic interventions aimed at correcting potassium levels could improve insulin sensitivity [9, 10]. A meta-analysis collecting data from randomized controlled trials confirmed a significant inverse correlation between serum potassium level and blood glucose, whereas potassium supplementation alleviated such an effect [8]. Serum potassium levels are inversely correlated with incidence of diabetes. Individuals with lower serum potassium levels possess greater insulin resistance. Acute and chronic hypokale mia can limit control of diabetes by impairing insulin release and reducing insulin sensitivity [11]. Abdominal obesity as another risk factor is associated with low plasma potassium levels in patients under thiazide therapy [12]. In addition, the impact of potassium depletion on metabolic disorders is mediated partly by deterioration of endothelial function via reduction of nitric oxide, which is needed to maintain endothelial function [13].
Therefore, understanding the genetic and physiological causes of metabolic diseases as well as their regulation by environmental factors, such as dietary habits, physical activity, or the microbiome, is a priority in biomedical genome research. Genetically modified animal models and mutant mouse lines are extremely important for investigating genetic causes, pathogenesis, early diagnosis, and therapies for metabolic disorders. International programs are aimed at compiling a complete overview of the functions of mammalian genes using knockout mutations in mice for all protein-coding genes [14]. These mouse models are useful tools for identifying genetic functions related to metabolic disease.
An annealing control primer (ACP) system is a highly accurate and sensitive polymerase chain reaction (PCR) method used to amplify minute amounts of genetic material available in tissue samples [15, 16]. Primers anneal specifically to a template, and only genuine products are amplified. Differentially expressed genes (DEGs) between control versus experimental groups have been identified using the ACP PCR technique.
In this study, we examined several physiological variables in high-fat diet mice, including serum composition, body weight, total calorie intake, and differentially expressed genes, to understand the impact of a high-fat diet.
Materials and Methods
Animals and study design
Mice (C57BL/6J strain) were used in this study (SamTaKo, Osan, Korea). Animals were reared and maintained under specific pathogen-free conditions. All animal experiments were carried out in accordance with the guidelines for animal experimentation and with permission from the Kyungpook National University Animal Use and Care Committee. Mice were housed in laboratory cages at a temperature of 24°C and 50% humidity under a 12 hr light/dark cycle. Mice were divided into two groups, and each group (n=10) was given free access to a different diet for 10 weeks. Male mice were fed a normal diet (ND, 10% fat, Research Diets Inc.) and high-fat diet (HD, 60% fat, Research Diets Inc.) starting at 8 weeks of age. Body weight and food intake were monitored weekly. Muscle atrophy was induced by surgery in the hind limb at approximately the mid-femur. Unilateral collection of the hind limb was performed at 10 weeks after the end of each diet (n=5 per group). This study was approved by the Institutional Animal Care and Use Committee (IACUC) of Kyungpook National University (approval no:2014-0037-1).
Tissue sampling
Muscle samples from the femoral region were taken from both ND and HD mice. Blood samples were collected from the retro-orbital plexus, and blood analyses were carry out using an i-STAT system with a CG8+ cartridge for sodium, potassium, ionized calcium, glucose, hematocrit, hemoglobin, pH, PCO2, PO2, TCO2+, HCO3+, base excess, and SO2.
Total RNA preparation
Total RNA was isolated from the femoral region with Trizol reagent (Invitrogen, Carlsbad, CA). Extracted RNA was quantified spectrophotometrically.
Reverse transcription
Reverse transcription was performed by RNA denaturation for 5 min at 65°C and elongation for 90 min at 42°C with dT-ACP1 primer. After a stop reaction for 5 min at 95°C, samples were held at 4°C until the next experiment. A final reaction volume of 20 μL consisted of 2 μg of RNA, 4 μL of 5 × reaction buffer, 5 μL of dNTP (each 2 mM), 2 μL of 10 mM cDNA synthesis primer dT-ACP1, 0.5 μL of RNase inhibitor, and 1 μL of SuperScript II Reverse Rranscriptase (Invitrogen, Carlsbad, CA). The final reaction mixture was diluted in 190 μL of water.
Annealing control primer (ACP)-PCR
cDNAs were amplified to second-strand cDNA by random PCR amplification using dT-ACP2 and an ACP primer (Table 1). The second round of PCR consisted of 40 amplification cycles at 94°C for 1 min, 50°C for 3 min, and 72°C for 1 min. A third round of PCR was performed at 94°C for 40 sec, 65°C for 40 sec, and 72°C for 1 min. The PCR protocols in this study were performed as described by Na et al. [17]. PCR products were loaded and run on 2% agarose gels and then stained with 1 mg/mL of ethidium bromide.
Table 1.
List of primers for the ACP-PCR system
|
|
Primer |
Sequences |
|
cDNA synthesis |
dT-ACP1 |
CTGTGAATGCTGCGACTACGATIIII(T)18 |
|
|
ACP-PCR |
dT-ACP2 (reverse) |
CTGTGAATGCTGCGACTACGATIIIII(T)15 |
|
|
ACP1 |
GTCTACCAGGCATTCGCTTCATIIIIIGCCATCGACC |
|
|
ACP2 |
GTCTACCAGGCATTCGCTTCATIIIIIAGGCGATGCC |
|
|
ACP3 |
GTCTACCAGGCATTCGCTTCATIIIIICCGGAGGATG |
|
|
ACP4 |
GTCTACCAGGCATTCGCTTCATIIIIIGCTGCTCGCG |
|
|
ACP5 |
GTCTACCAGGCATTCGCTTCATIIIIIAGTGCGCTCG |
|
|
ACP6 |
GTCTACCAGGCATTCGCTTCATIIIIIGGCCACATCG |
|
|
ACP7 |
GTCTACCAGGCATTCGCTTCATIIIIIGGTCACGGAG |
|
|
ACP8 |
GTCTACCAGGCATTCGCTTCATIIIIIGATGCCGCTG |
|
|
ACP9 |
GTCTACCAGGCATTCGCTTCATIIIIITGGTCGTGCC |
|
|
ACP10 |
GTCTACCAGGCATTCGCTTCATIIIIICTGCAGGACC |
|
|
ACP11 |
GTCTACCAGGCATTCGCTTCATIIIIIACCGTGGACG |
|
|
ACP12 |
GTCTACCAGGCATTCGCTTCATIIIIIGCTTCACCGC |
|
|
ACP13 |
GTCTACCAGGCATTCGCTTCATIIIIIGCAAGTCGGC |
|
|
ACP14 |
GTCTACCAGGCATTCGCTTCATIIIIIGCAAGTCGGC |
|
|
ACP15 |
GTCTACCAGGCATTCGCTTCATIIIIICCACCGTGTG |
|
|
ACP16 |
GTCTACCAGGCATTCGCTTCATIIIIIGTCGACGGTG |
|
|
ACP17 |
GTCTACCAGGCATTCGCTTCATIIIIICAAGCCCACG |
|
|
ACP18 |
GTCTACCAGGCATTCGCTTCATIIIIICGGAGCATCC |
Download Excel Table
Cloning and sequencing of differentially expressed genes (DEGs)
PCR products confirmed as being differentially expressed were used for cloning. PCR products were extracted and cloned into TOPO TA vector using a TA Cloning Kit (Invitrogen, Carsbad, CA). The constructed vectors were transformed into competent TOP10 Escherichia coli cells. Colonies were cultured on LB agar plates with ampicillin overnight in a 37°C incubator. Colonies were selected and cultured in LB broth overnight in a shaking incubator. DNA was prepared, after which the sequences were determined. To identify the DNA inserts, sequences were analyzed using a National Center for Biotechnology Information (NCBI) Blast search.
Results
Effect of high-fat diet
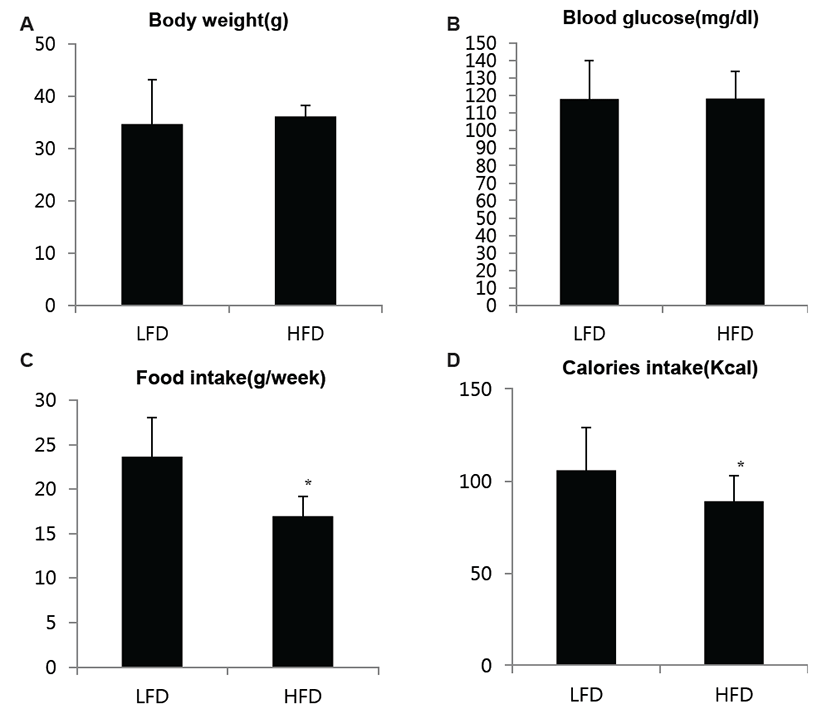
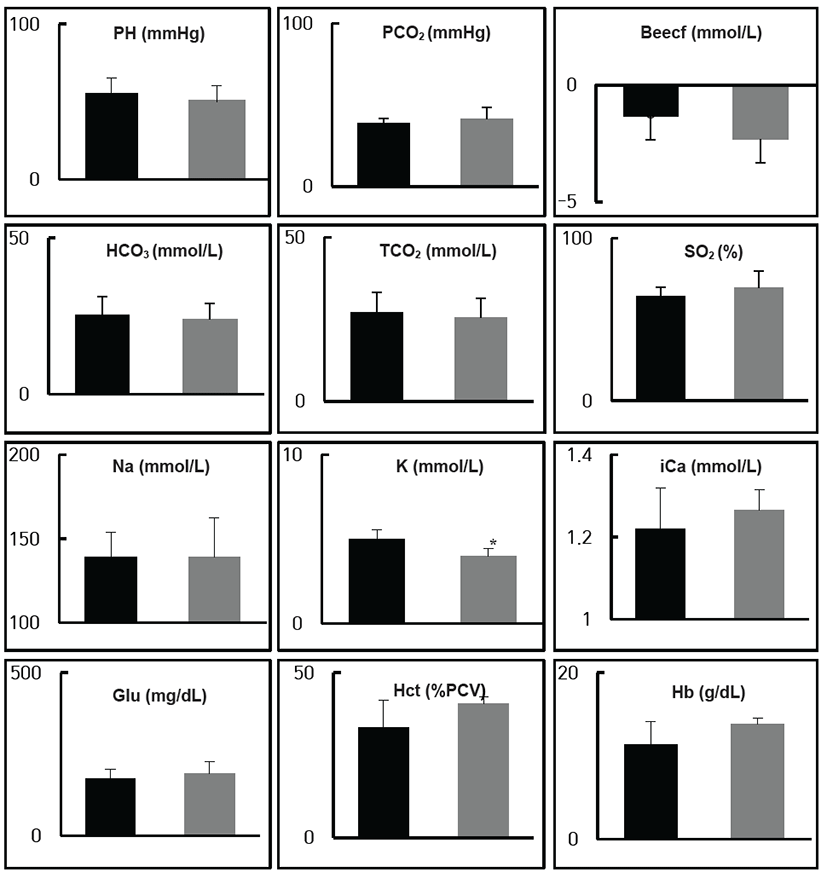
For mice fed a ND or HD, body weight and blood glucose levels were not significantly different. However, the high-fat diet groups showed reduced calorie and food intakes (Fig. 1). To compare bloodstream compositions between the two groups, blood samples from the Retro-Orbital plexus were checked using the i-STAT system. Sodium, ionized calcium, glucose, hematocrit, hemoglobin, pH, PCO2, PO2, TCO2+, HCO3+, base excess, and SO2 were not significantly different between the ND and HD groups. Potassium (K) concentration, however, was different between the two treatment groups (Fig. 2).
Fig. 1.
Analysis of serum samples of mice fed normal and high-fat diets. Sodium (Na), Iody weight and blood glucose levels were not significantly different. The high-fat diet groups showed reduced calorie and food intakes. Data are shown as the means ± S.D. of values obtained from triplicate experiments. Differences were evaluated using Student's t-test (*, p<0.05)
Download Original Figure
Fig. 2.
Analysis of serum samples of mice fed normal and high-fat diets. Sodium (Na), Ionized Calcium (Ca), Glucose (Glu), Hematocrit (Hct), Hemoglobin (Hgb), pH, PCO2, PO2, TCO2+, HCO3+, base excess (BE), and SO2 were not significantly different between mice fed high-fat and normal diets. However, differences in potassium (K) concentration were detected. Data are shown as the means ± S.D. of values obtained from triplicate experiments. Differences were evaluated using Student's t-test (*, p<0.05)
Download Original Figure
Identification of differentially expressed genes
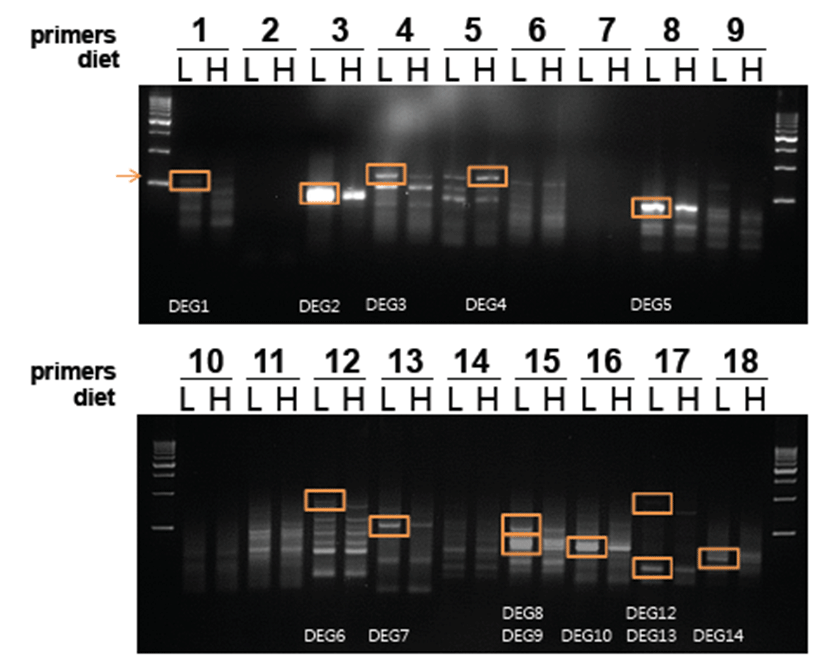
To identify differentially expressed genes, RNA was extracted from the femoral region of mice, and cDNAs were synthesized using 2 μg of RNA. The cDNAs were amplified by ACP-PCR using ACP primers (Table 1). Each primer set amplified different PCR products, as shown in Fig. 3. Differentially expressed bands were identified from 14 fragments that were amplified using primers 1, 3, 4, 5, 8, 12, 13, 15, 16, 17, and 18 (Fig. 3). PCR products were visualized by electrophoresis and purified using a gel purification system (Qiagen, USA). Finally, four genes were identified by DNA sequencing and Blast search (Table 2). Transposon-insertion related genes and hypothetical protein genes showed high similarities with these genes.
Fig. 3.
Differentially expressed genes in muscle tissue from mice fed normal and high-fat diets. Differential expression of genes was determined with 14 cDNA fragments amplified by ACP-PCR using primers 1, 3, 4, 5, 8, 12, 13, 15, 16, 17, and 18. PCR products were visualized by electrophoresis and ethidium bromide staining of gels using a UV illuminator. WT (M: marker, C: control diet, H: high-fat diet)
Download Original Figure
Table 2.
List of differentially expressed genes in mice fed a high-fat diet and normal diet
|
DEG No. |
Expression Up or Down |
Sequence homology search |
|
Accession No. |
Gene name |
|
DEG 2 |
Down |
EU558532.1 |
Arabidopsis lyrata cline MITE7 transposon-insertion display band genomic sequence |
|
DEG 2 |
Down |
EU558531.1 |
Arabidopsis lyrata cline MITE6 transposon-insertion display band genomic sequence |
|
DEG 3 |
Down |
AM946177.1 |
Gibberella miniliformis p450-4 gene for ent-kaurene oxidase |
|
DEG 3 |
Down |
EU874251.1 |
Burkholderia cenocepacia strain K56-2 hypothetical protein gene |
|
DEG 4 |
Up |
AM747472.1 |
Flagellophora apelti partial 28S rRNA gene |
|
DEG 4 |
Up |
AB298934.1 |
Bombyx mori dh40 mRNA for diuretic hormone 40 |
|
DEG 4 |
Up |
HE971736.1 |
Platynereis dumerilli partial mRNA for transcription factor Id |
|
DEG 13 |
Down |
FM242736.1 |
Archaeon partial 16S rRNA gene |
Download Excel Table
Discussion
Diabetes is classified into two categories, type-1 diabetes and type-2 diabetes, characterized by insulin secretion and insulin resistance, respectively. The disease mechanisms, pathogenesis, and treatment of diabetes have been reviewed in detail elsewhere [18-20].
Commonly, different strains of mice demonstrate different responsiveness to high-fat diets [21]. Here, we used C57BL/6N mice to study the effects of high-fat diet consumption. Around 10% of C57BL/6N mice showed no increase in body weight, despite being on a high fat diet. In general, the body weight of mice fed a high-fat diet was higher than that of mice fed a general diet. This result can be attributed mostly to differences in feed efficiency or expression of diet-related specific genes. However, this study focused on the fact that mice that were resistant to high-fat diet showed differences with normal mice in the phenotype of entity which the bodyweight was not increased.
This study demonstrated differences between mice fed a normal diet or high-fat diet without changes in body weight. However, there were several differences in blood composition and gene expression.
Mice fed a high-fat diet showed lower serum potassium levels (Fig. 2). High-fat diet mice showed no difference in total calorie intake or body weight compared to the mice fed a normal diet (Fig. 1). Adults with lower serum potassium levels and potassium intake are at higher risk for diabetes onset [22]. Low potassium level has been associated with increased insulin resistance in both basic research [23] and epidemiological studies [24, 25]. Acute and chronic hypokalemia can worsen diabetic control partly by reducing tissue sensitivity to insulin [11]. Additionally, central obesity patients have lower potassium levels in their plasma [12]. There is an evidence that potassium depletion can lead to low nitric oxide levels and endothelial dysfunction [26, 27]. These negative effects may lead to insulin resistance, hypertriglyceridemia, and glucose intolerance. Moreover, chronic hypokalemia in primary aldosteronism (PA) patients can indirectly reduce adiponectin levels, which may result in insulin resistance. Therefore, elevation of both potassium and adiponectin levels can improve insulin sensitivity. The relationship between potassium and glucose levels and lipid metabolism has been described [7]. Lower potassium levels can increase the risk of metabolic syndrome [7]. According to these results, lower potassium levels are related to HD. Additional studies are required to clarify this.
The ACP-PCR technique was developed by the Seegene Company as an accurate and widely applicable technique. In this study, primers 3 and 8 with ACP2-amplified specific bands decreased in HD mice samples. These genes were clarified by DEG cloning in Topo vector and by sequencing methods (Table 2). The KCN gene family has been shown to be differentially expressed based on the potassium concentration in the blood [28]. The purpose of this study was to discover new genes as a result of ACP PCR using 20 random primers. Known genes were excluded from this result. In addition, the relationships among candidate genes and high-fat diet according to potassium concentration in the blood will be clarified in the future.
Acknowledgements
This research was supported by the Kyungpook National University Research Fund, 2013, 2014. and Basic Science Research Program through the National Research Foundation of Korea (NRF) funded by the Ministry of Education (2014R1A6A3A04059193).
REFERENCES
Zhang Y, Proenca R, Maffei M, Barone M, Leopold L, Friedman JM. Positional cloning of the mouse obese gene and its human homologue. Nature. 1994; 372 p. 425-432.

Ahima RS. Central actions of adipocyte hormones. Trends Endocrinol Metab. 2005; 16 p. 307-313.
Fortuno A, Rodriguez A, Gomez-Ambrosi J, Fruhbeck G, Diez J. Adipose tissue as an endocrine organ: role of leptin and adiponectin in the pathogenesis of cardiovascular diseases. J Physiol Biochem. 2003; 59 p. 51-60.
Mohamed-Ali V, Pinkney JH, Coppack SW. Adipose tissue as an endocrine and paracrine organ. Int J Obes Relat Metab Disord. 1998; 22 p. 1145-1158.
Colt EW, Wang J, Stallone F, Van Itallie TB, Pierson Jr RN. A possible low intracellular potassium in obesity. Am J Clin Nutr. 1981; 34 p. 367-372.
Sun K, Lu J, Jiang Y, Xu M, Xu Y, Zhang J, Xu B, Sun J, Sun W, Ren C, Liu J, Wang W, Bi Y, Ning G. Low serum potassium level is associated with nonalcoholic fatty liver disease and its related metabolic disorders. Clin Endocrinol (Oxf). 2014; 80 p. 348-355.
Sun K, Su T, Li M, Xu B, Xu M, Lu J, Liu J, Bi Y, Ning G. Serum potassium level is associated with metabolic syndrome: a population-based study. Clin Nutr. 2014; 33 p. 521-527.
Zillich AJ, Garg J, Basu S, Bakris GL, Carter BL. Thiazide diuretics, potassium, and the development of diabetes: a quantitative review. Hypertension. 2006; 48 p. 219-224.
Norbiato G, Bevilacqua M, Meroni R, Raggi U, Dagani R, Scorza D, Frigeni G, Vago T. Effects of potassium supplementation on insulin binding and insulin action in human obesity: protein-modified fast and refeeding. Eur J Clin Invest. 1984; 14 p. 414-419.
Fallo F, Della Mea P, Sonino N, Bertello C, Ermani M, Vettor R, Veglio F, Mulatero P. Adiponectin and insulin sensitivity in primary aldosteronism. Am J Hypertens. 2007; 20 p. 855-861.
Unwin RJ, Luft FC, Shirley DG. Pathophysiology and management of hypokalemia: a clinical perspective. Nat Rev Nephrol. 2011; 7 p. 75-84.
Mariosa LS, Ribeiro-Filho FF, Batista MC, Hirota AH, Borges RL, Ribeiro AB, Zanella MT. Abdominal obesity is associated with potassium depletion and changes in glucose homeostasis during diuretic therapy. J Clin Hypertens (Greenwich). 2008; 10 p. 443-449.
Nakagawa T, Sato W, Glushakova O, Heinig M, Clarke T, Campbell-Thompson M, Yuzawa Y, Atkinson MA, Johnson RJ, Croker B. Diabetic endothelial nitric oxide synthase knockout mice develop advanced diabetic nephropathy. J Am Soc Nephrol. 2007; 18 p. 539-550.
Faucherre M, Pazar B, So A, Aubry-Rozier B. [Rheumatology. TNF alpha-inhibitors: infection risks? Practical recommendations]. Rev Med Suisse. 2011; 7 p. 75-76.
Hwang IT, Kim YJ, Kim SH, Kwak CI, Gu YY, Chun JY. Annealing control primer system for improving specificity of PCR amplification. Biotechniques. 2003; 35 p. 1180-1184.
Kim YJ, Kwak CI, Gu YY, Hwang IT, Chun JY. Annealing control primer system for identification of differentially expressed genes on agarose gels. Biotech niques. 2004; 36 p. 424-426.
Hee Sam, Na JSK, Chung Jin. Identification of differentially expressed genes using an annealing control primer system in periodontitis. International Journal of Oral Bioiogy. 2012; 37 p. 109-114.
Atkinson MA, Eisenbarth GS. Type 1 diabetes: new perspectives on disease pathogenesis and treatment. Lancet. 2001; 358 p. 221-229.
Defronzo RA. Banting Lecture. From the triumvirate to the ominous octet: a new paradigm for the treatment of type 2 diabetes mellitus. Diabetes. 2009; 58 p. 773-795.
Halban PA, Polonsky KS, Bowden DW, Hawkins MA, Ling C, Mather KJ, Powers AC, Rhodes CJ, Sussel L, Weir GC. beta-cell failure in type 2 diabetes: postulated mechanisms and prospects for prevention and treatment. J Clin Endocrinol Metab. 2014; 99 p. 1983-1992.
Surwit RS, Seldin MF, Kuhn CM, Cochrane C, Feinglos MN. Control of expression of insulin resistance and hyperglycemia by different genetic factors in diabetic C57BL/6J mice. Diabetes. 1991; 40 p. 82-87.
Chatterjee R, Yeh HC, Shafi T, Selvin E, Anderson C, Pankow JS, Miller E, Brancati F. Serum, dietary potassium and risk of incident type 2 diabetes mellitus: The Atherosclerosis Risk in Communities (ARIC) study. Arch Intern Med. 2010; 170 p. 1745-1751.
Reungjui S, Roncal CA, Mu W, Srinivas TR, Sirivongs D, Johnson RJ, Nakagawa T. Thiazide diuretics exacerbate fructose-induced metabolic syndrome. J Am Soc Nephrol. 2007; 18 p. 2724-2731.
Plavinik FL, Rodrigues CI, Zanella MT, Ribeiro AB. Hypokalemia, glucose intolerance, and hyperinsulinemia during diuretic therapy. Hypertension. 1992; 19 p. II26-29.
Helderman JH, Elahi D, Andersen DK, Raizes GS, Tobin JD, Shocken D, Andres R. Prevention of the glucose intolerance of thiazide diuretics by maintenance of body potassium. Diabetes. 1983; 32 p. 106-111.
Reungjui S, Hu H, Mu W, Roncal CA, Croker BP, Patel JM, Nakagawa T, Srinivas T, Byer K, Simoni J, Wesson D, Sitprija V, Johnson RJ. Thiazide-induced subtle renal injury not observed in states of equivalent hypokalemia. Kidney Int. 2007; 72 p. 1483-1492.
Yang BC, Li DY, Weng YF, Lynch J, Wingo CS, Mehta JL. Increased superoxide anion generation and altered vasoreactivity in rabbits on low-potassium diet. Am J Physiol. 1998; 274 p. H1955-1961.
Zhou PZ, Babcock J, Liu LQ, Li M, Gao ZB. Activation of human ether-a-go-go related gene (hERG) potassium channels by small molecules. Acta Pharmacol Sin. 32 p. 781-788.