Introduction
In cats with diabetes mellitus, persistent hyperglycemia may result from inappropriate insulin administration, dose, or formulation; recurring pancreatitis; hepatic lipidosis; cholangiohepatitis; urinary tract infection; renal failure; hyperthyroidism; inflammatory bowel disease; or concomitant diseases that cause insulin resistance, such as hyperadrenocorticism and acromegaly [1-3]. Generally, insulin resistance refers to a clinical syndrome in which a typically adequate amount of insulin fails to induce a normal biological response [4]. There is no specific insulin dose that is diagnostic for insulin resistance. However, cats with diabetes mellitus are generally considered to have insulin resistance if the serum glucose concentration routinely exceeds 300 mg/dL when the insulin dosage exceeds 6 to 8 U per dose or if excessive amounts of insulin (e.g., >2.2 U/kg) are needed to maintain serum glucose concentrations <300 mg/dL [4, 5].
In cats, pituitary-dependent hyperadrenocorticism (PDH) and acromegaly are rare diseases [4, 6-9]. PDH and acromegaly are usually associated with insulin-resistant diabetes mellitus in cats. Chronic hypersecretion of growth hormone by a functional adenoma of the somatotropic cells of the pituitary pars distalis causes acromegaly, which is characterized by insulin-resistant diabetes mellitus and progressive overgrowth of soft tissue, membranous bone, and viscera. Glucose metabolism is affected by growth hormone both directly and through the somatomedins or serum insulin-like growth factor.
A diagnosis of acromegaly is currently based upon a combination of clinical signs, measurement of growth hormone and/or insulin-like growth factor-1 (IGF-1), and intracranial imaging. Acromegaly has been reported as the underlying cause of diabetes mellitus in 24~32% of diabetic cats [2, 5].
The present report describes for the clinical findings and the diagnostic image features for double adenoma in a cat with insulin-resistant diabetes mellitus.
Case report
A 10-year-old castrated male Korean shorthair cat weighing 4 kg was presented with signs of insulin-resistant diabetes mellitus. The cat’s diagnosis of diabetes mellitus had been made based on the clinical signs of polyuria, polydipsia, and polyphagia. Despite insulin therapy, the cat continued to have polyuria, polydipsia, and polyphagia and exhibited weight loss (decreased from 6.5 kg to 4 kg over a 2-month period), persistent hyperglycemia (400~600 mg/dL; reference range [RR], 63~140 mg/dL), and glucosuria. Furthermore, the cat had behavioral abnormalities such as inappropriate urination and defecation and biting the armrest of a chair. The cat was receiving 20 U of insulin/dose (Glargine 5 U/kg/dose, Lantus, SANOFI). Blood glucose concentrations measured by means of the glucose oxidase method (Accu-Chek Active®; Roche, Germany) at 8 AM after food (60 kcal/kg/day; Obesity Management (Dry), Royal Canin, Aimargues, France) had been withheld for 12 hr (fasting glucose concentration [FGC]) and every 2 hr for 12 hr after food was offered (mean glucose concentration [MGC]). FGC and MGC12hr were 400~600 mg/dL. Thus, the cat was considered to have insulin resistance. We performed blood work, urinalysis, radiography, ultrasonography, and endocrine function testing to identify the potential causes of insulin resistance, which include administration of glucocorticoids or megestrol acetate, obesity, poor absorption of subcutaneous insulin, infection, ketoacidosis, hyperthyroidism, hyperadrenocorticism, and acromegaly.
Serum biochemical profile abnormalities included increased blood urea nitrogen (BUN; 42 mg/dL; RR, 17~35 mg/dL), hyperglycemia (600 mg/dL; RR, 63~140 mg/dL), hypercholesterolemia (297 mg/dL; RR, 73~265 mg/dL), hyperbilirubinemia (0.5 mg/dL; RR, 0~0.2 mg/dL), increased gamma-glutamyl transpeptidase (GGT; 12 IU/L; RR, 0~10 IU/L), hypoproteinemia (6.6 g/dL; RR, 6.7~8.5 g/dL), hypoalbuminemia (2.8 g/dL; RR, 2.9~4.3 g/dL), and hyponatremia (139.2 mmol/L; RR, 147~162 mmol/L). A complete blood count revealed a mild leukocytosis (21.2 × 10³/μL; reference range, 6~18 × 103/μL) with a neutrophilia. Thoracic radiographs from cat that did not have radiographic abnormalities were assessed by a cardiologist and a radiologist and then measured. Lateral radiographs-Mean VHS for all cats (sum of the cardiac long and short axes) was 7.5 ± 0.3 v (range, 6.7 to 8.1 v).Thoracic radiographs were unremarkable. Abdominal radiographs revealed hepatomegaly and bilateral renomegaly. Abdominal ultrasonography identified enlargement of both adrenal glands. The dorsoventral widths of the left and right adrenal glands were 7.4 mm (RR, 4.3 ± 0.3 mm) and 7.6 mm (RR, 4.3 ± 0.3 mm), respectively [9]. The echogenicity of the liver was diffusely increased. The cortices of both kidneys had increased echogenicity. The echogenicity of the parenchymal tissue in the pancreas was heterogenous and the pancreas had multiple cysts. Urinalysis results indicated a urine specific gravity (USG) of 1.022 by refractometer (RR, 1.035~1.060), glucosuria (3+; RR, negative or 1+), and proteinuria (2+; RR, negative or 1+). Urine culture was negative. The polymerase chain reaction (PCR) test results for virus infection (feline panleukopenia virus, feline leukemia virus, feline immunedeficiency virus, feline calici virus, and feline herpes virus) were negative.
The adrenocorticotropic hormone (ACTH) stimulation test was performed by collecting blood before and then 60 and 90 min after intravenous (IV) injection of 0.125 mg ACTH (Cynacten; Dalim BioTech, Seoul, Korea). The ACTH stimulation test results revealed a basal cortisol level of 4.99 μg/dL (RR, 1.00~4.00 μg/dL), which increased to 22.4 μg/dL (RR, 4.50~15.00 μg/dL) and 19.6 μg/dL (RR, 4.50~15.00 μg/dL) at 60 and 90 min after administration of ACTH, respectively. These ACTH results were consistent with a diagnosis of hyperadrenocorticism. We performed a high-dose dexamethasone suppression test (HDDST) to discriminate between pituitary-dependent and adrenal-dependent hyperadrenocorticism. In the HDDST, plasma cortisol concentrations were evaluated immediately before and at 4 and 8 hr after IV administration of 0.1 mg/kg dexamethasone (Jeil Pharmaceutical Co. Ltd., Daegu, Korea). The criteria for suppression on the HDDST were a 4- or 8-hour cortisol concentration or both below the laboratory cut-off or <50% of the basal cortisol concentration [7, 8]. The HDDST results revealed a basal cortisol level of 5.25 μg/dL, which decreased to 1.69 μg/dL 4 hr after administration of dexamethasone but increased to 19.6 μg/dL 8 hr after administration of dexamethasone. The serum insulin-like growth factor-1 (IGF-1) concentration was increased at 449 nmoL/L (RR, 12~92 nmoL/L; IDEXX Laboratories, Inc., Westbrook, Maine, USA). The plasma total thyroxine concentration (T4) was 1.99 μg/dL (RR, 0.8~4.7 μg/dL). The above test results excluded other causes of insulin resistance (e.g., renal, hepatic, and cardiac insufficiency; infectious and inflammatory disorders; and hyperthyroidism). Therefore, the cause of insulin resistance was presumed to be PDH and acromegaly.
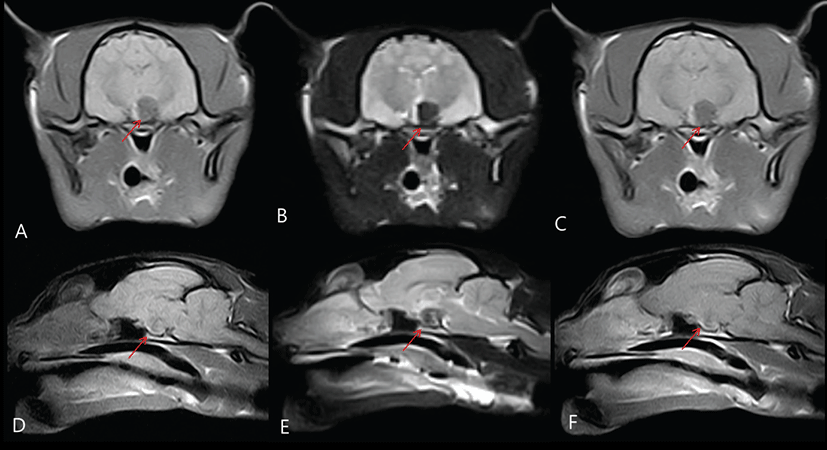
Magnetic resonance imaging was performed to further characterize the pituitary tumor that was believed to be the cause of acromegaly. For MRI (E-Scan; Esaote, Italy), anesthesia was induced with propofol (4 mg/kg, IV; Anepol®; Hana Pharm. Co. Ltd., Seoul, Korea). An endotracheal tube was placed and anesthesia was maintained with 2.5% isoflurane (Forane Soln®; ChoongWae Pharma Co. Ltd., Seoul, Korea) and oxygen. Magnetic resonance imaging identified a pituitary mass in the sella turcica. The pituitary of the cat was enlarged (approximately 8.36 × 7.52 × 7.24 mm; RR, 4 × 3 × 3 mm) and only partially enhanced after IV administration (0.1 mmoL/kg body weight) of the contrast agent gadolinium-diethylenetriaminepentaacetic acid (Gd-DTPA) (Magnevist, Berlex Canada, Montreal, Quebec) (Fig. 1) [10]. The pituitary gland had a predominantly unilateral extension to the left. The signal intensity of the pituitary gland on precontrast T1W images was hypointense compared to soft tissue and hyperintense compared to cerebrospinal fluid. On T2W images, the pituitary gland was predominantly hypointense with a hyperintense rim. Contrast enhancement of the pituitary gland was not evident and a mild degree of ring-like enhancement was seen (Fig. 1). Cerebrospinal fluid analysis was normal.

Computed tomography was performed for evaluation of abdominal cavity organ enlargement, which occurs as a result of acromegly. For the CT scan (Asteion 4®, Toshiba, Japan), preparation and anesthesia were the same as described for MRI. Contiguous 3 mm transverse slices of the entire abdominal cavity were acquired before and immediately after IV bolus administration (280 mg/mL) of a non-ionic contrast medium (Omnipaque™ GE Healthcare, Milwaukee, WI, United States). Images were viewed with dedicated viewing software with three-dimensional (3D) capabilities and a soft tissue algorithm.
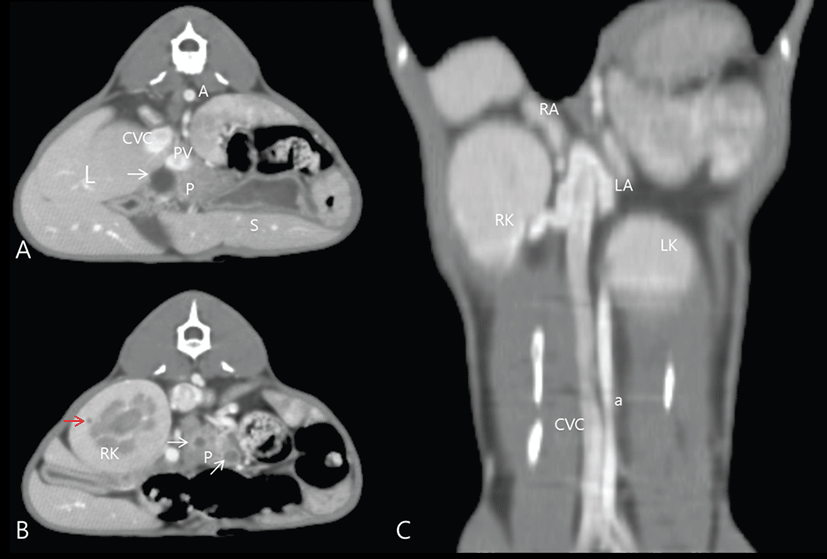
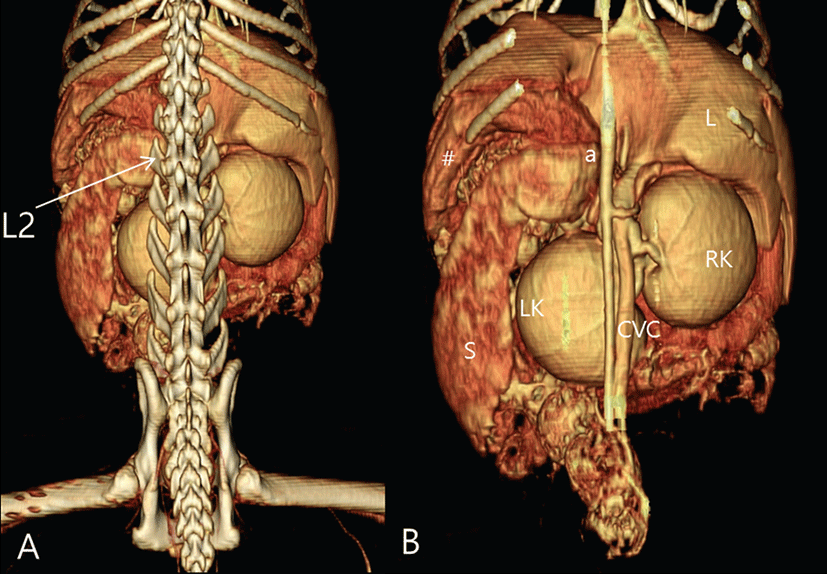
Computed tomography revealed hepatomegaly, renomegaly, bilateral adrenal gland enlargement (right adrenal gland, 15.7 × 10.65 × 6.77 mm; left adrenal gland, 15.33 × 8.56 × 6.97 mm), and general enlargement of the pancreas, which also contained multiple cysts ranging from 3 mm to 12 mm in size (Fig. 2). The dorsoventral view of the 3D volume-rendered image [11] showed both the location and the size of the hepatomegaly, renomegaly (3.3 times the body length of Lumber (L) 2, RR: 2.4 to 3 times the body length of L2), and splenomegaly (Fig. 3). The owners declined additional treatment on the cat. The cat was euthanized at owner request. In this case, a diagnosis of PDH and acromegaly were based on a combination of clinical signs, results from the ACTH stimulation test and HDDST, measurement of IGF-1, and findings from CT and MRI.


Discussion
The clinical features in the present case, including persistent hyperglycemia, were similar to those reported earlier for a cat with insulin resistance [4]. Through testing, other causes of insulin resistance were excluded, except a hormonal cause. Common endocrine causes of insulin resistance in cats with diabetes mellitus are hyperthyroidism, hyperadrenocorticism, and acromegaly [4]. For diagnosis of hyperadrenocorticism, we performed the ACTH stimulation tests and the HDDST and hyperthyroidism was ruled out based on clinical signs, including agitation, sleeping less than usual, patchy alopecia, unkempt hair coat, seeking cool areas to sit or sleep, and increased vocalization and the measured T4 level , which was within the reference range [7]. Plasma concentrations of cortisol after ACTH injection were higher than the basal value. This cat was considered to have PDH on the basis of the ACTH stimulation test results, HDDST results (<50% of baseline at 4 hr; >1.5 μg/dL and >50% of baseline at 8 hr), and abdominal ultrasonography [7, 8]. According to the ACTH stimulation test and HDDST results [4, 7], the cat was diagnosed with PDH with secondary diabetes mellitus. Increased serum IGF-1 is used as a screening test for acromegaly [2, 5, 12, 13]. In the present case, a tentative diagnosis of acromegaly was based on elevated plasma IGF-1 levels [12, 13]. In addition, acromegaly typically causes insulin resistance, resulting in poorly controlled diabetes in cats [14, 15]. Therefore, we decided to evaluate the pituitary gland for evidence of a mass based on the elevated IGF-1 concentration and the result of the ACTH stimulation test. Magnetic resonance imaging was performed to identify the presence of a pituitary tumor responsible for causing acromegaly [15]. Magnetic resonance imaging is the technique of choice for diagnostic imaging of the pituitary gland in people, dogs, and cats [1, 16]. Generally, the normal feline pituitary gland enhances uniformly [17]. However, contrast enhancement of the pituitary gland of our cat was not evident and we observed a ring-like enhancement. This irregular enhancement could be related to areas of avascularity, such as necrosis, hemorrhage, or cyst formation [5]. In humans, reduced contrast enhancement occurs with pituitary adenoma [16]. In one report from an acromegalic cat [1], a large pituitary mass did not enhance on MRI following contrast medium administration. In our case, we observed a spherical mass including the pituitary gland in sellar cavity regions. The pituitary gland had a hypointense signal on precontrast T1W and T2W images and contrast enhancement was not evident, although a ring-like enhancement was seen. A hyperintense rim surrounded the pituitary gland on T1W and T2W images in our case. This hyperintense rim is also described as fatty infiltration due to chronic inflammation or compression [17] on T1W images. Considering the MRI findings, we suspected a pituitary tumor, such as an adenoma [1, 6, 10, 18, 19]. In the present study, a tentative diagnosis of acromegaly was based on elevated plasma IGF-1 levels, exclusion of other diseases that could cause insulin resistance, and the demonstration of a pituitary tumor using MRI.
In humans, generally, a diagnosis of acromegaly can be confirmed through an elevated plasma IGF-1 level and levels decrease following successful tumor excision [20]. Increased serum IGF-1 concentrations have been reported previously [1, 3, 20, 21] in diabetic cats with acromegaly, suggesting that serum IGF-1 may be a useful diagnostic test for acromegaly in diabetic cats. In a previous report [12], a cat with acromegaly had a serum IGF-1 level that was elevated by comparison with those of two clinically normal cats. IGF-1 has been used in place of serum growth hormone quantification for identifying acromegaly in cats with diabetes that is difficult to control [2, 4, 8, 17].
In this case, CT images revealed that the cat had hepatomegaly, renomegaly, splenomegaly, pancreatic enlargement, and bilateral adrenomegaly. Acromegly can cause enlargement of abdominal cavity organs [14]. In a previous study [14], 14 middle-aged cats with acromegaly had enlargement of one or more organs (e.g., liver, heart, kidneys, and tongue), cardiomyopathy, nephropathy associated with azotemia and clinical signs of renal failure, degenerative arthropathy, and central nervous system signs (i.e., circling and seizures) caused by enlargement of the pituitary tumor. In our case, cardiomyopathy, degenerative arthropathy, and central nervous system signs were not identified. The major role of 3D CT imaging for abdominal cavity organ concentrates on the noninvasive evaluation of abdominal cavity organ anatomy and abnormalities such as organ masses [11].
In the present case, the pancreas was generally enlarged and had multiple parenchymal cysts. Pancreatic cystic lesions may occur as a result of secondary change by due to diabetes mellitus or pancreatitis. Reported pancreatic cystic lesions include benign cystic lesions of disease, secondary change due to diabetes mellitus, pancreatitis, a primary pancreatic malignant tumor, and a malignant tumor metastasis [12, 14]. Therefore, clinicians must be able to differentiate among the diagnoses for pancreatic lesions.
Definitive diagnosis of feline acromegaly can be difficult because of the gradual onset, subtle clinical signs, and unavailability of relevant laboratory tests, such as the feline growth hormone assay [4, 22]. Acromegaly in cats can result from a functional somatotropic adenoma or hyperplasia of the pituitary gland resulting in chronic, excessive secretion of growth hormone. This cat in this case was diagnosed with acromegaly and PDH based upon a combination of clinical signs, elevated IGF-1 levels, ACTH stimulation test results, and CT and MRI findings in a diabetic cat with insulin resistance.
In conclusion, this case demonstrates that cats with insulin resistance suspected to have acromegaly and PDH are likely to have a pituitary mass detectable by means of CT or MRI. In addition these results support the use of serum IGF-1 concentration as a screening test for acromegaly in diabetic cats with insulin resistance.